

Circumference, area of a circle and the number π
A wheel rolls once and travels a bit more than three times its diameter. Cut into pieces, the circle becomes a rectangle and the area formula follows.
Double grade 7/8: the core curriculum describes what should be achieved by the end of grade 8, so the units are the same for grades 7 and 8. Both grades are therefore shown as one stage. The numbers (guiding idea.content area.focus) are our own.
Extension to rational and real numbers (roots, π); numbers are shown on the number line and as decimals, compared and rounded; orientation in the full coordinate system.
Positive and negative fractions and decimals as one number set.
No separate simulation is planned for this.
Getting to know irrational numbers such as square roots and π and approximating them.
A wheel rolls once and travels a bit more than three times its diameter. Cut into pieces, the circle becomes a rectangle and the area formula follows.

Step by step, a rectangle turns into a square with the same area. The method is almost 2000 years old and reaches √2 surprisingly quickly.
Representing rational and real numbers on the number line and in decimal notation.
No separate simulation is planned for this.
Ordering numbers of both signs and rounding sensibly.
No separate simulation is planned for this.
Plotting and reading points in all four quadrants.
No separate simulation is planned for this.
Calculating with rational and real numbers, transforming terms with variables and brackets, powers, and percentage and interest calculations in real-life contexts.
Applying sign rules and arithmetic laws confidently.
No separate simulation is planned for this.
Expanding and factorising brackets and using the binomial formulas.

The three binomial formulas as areas: a square splits into smaller squares and rectangles.

An expression drawn as a tree: whatever hangs lowest is calculated first. The order of operations stops being a rule and becomes visible.
Extending power notation to negative and fractional exponents.
No separate simulation is planned for this.
Setting up, structuring and transforming terms with variables.
An expression drawn as a tree: whatever hangs lowest is calculated first. The order of operations stops being a rule and becomes visible.
Calculating base value, percentage value, rate and interest.

Discounts, VAT, surveys: one single bar holds the base value, the percentage and the part, one above the other.
Calculating price increases and discounts using growth or decay factors.
Discounts, VAT, surveys: one single bar holds the base value, the percentage and the part, one above the other.
Combining several successive percentage changes.
No separate simulation is planned for this.
Quadrilaterals and circles are classified and constructed, also with dynamic geometry software; symmetry and all four quadrants of the coordinate system.
Getting to know further basic figures and their properties.

Move one corner and the square becomes a kite. When does a quadrilateral get which name?
Ordering quadrilaterals by properties and justifying relationships between them.
Move one corner and the square becomes a kite. When does a quadrilateral get which name?
Constructing triangles, perpendicular bisectors, angle bisectors and more.
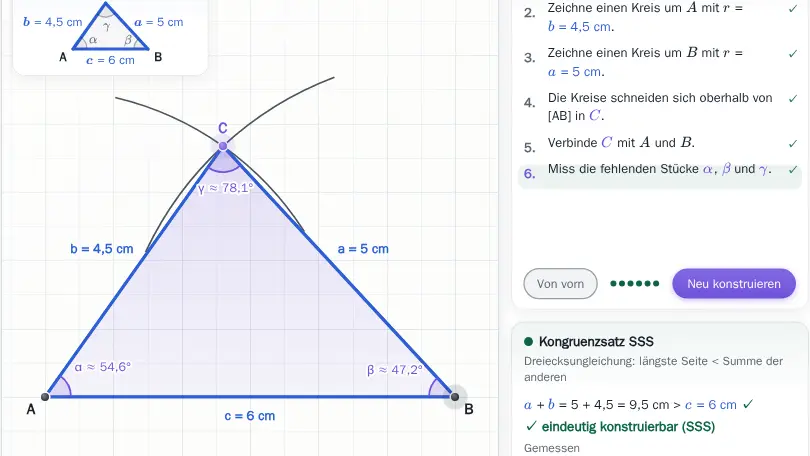
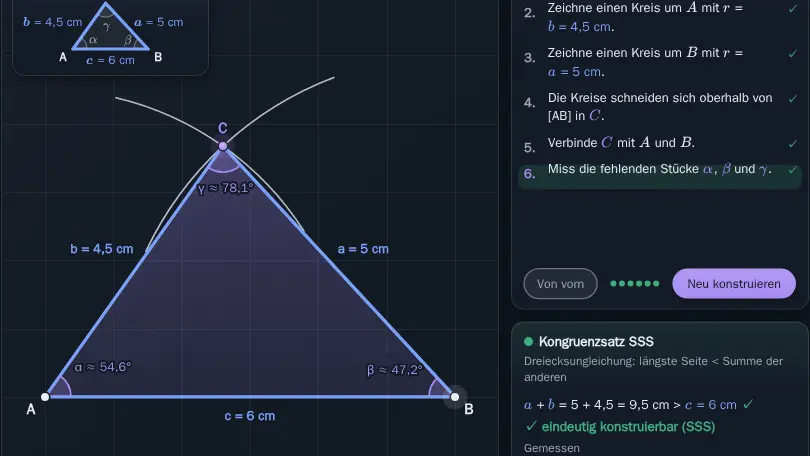
Construct triangles from three given parts with ruler and compass, step by step as in your exercise book. Sometimes there are no, one or two solutions.

A point equally far from A and B never lies there by chance: the perpendicular bisector appears before you draw it with compasses.
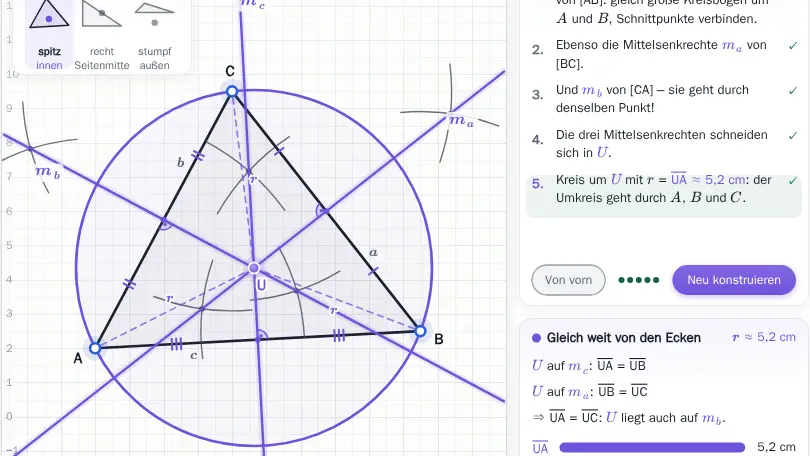

Construct the special lines in a triangle. Each set of three always meets in one point, for example at the centre of the circumcircle or the incircle.
Examining line and point symmetry of figures.

In a line or in a point: the shape flips over, and every construction step with the set square stays visible.
Representing figures in the full coordinate system.
No separate simulation is planned for this.
Prism and circular cylinder: representation by models, oblique drawings and nets, and description of volume and surface area.
Recognising prisms and cylinders and describing their properties.
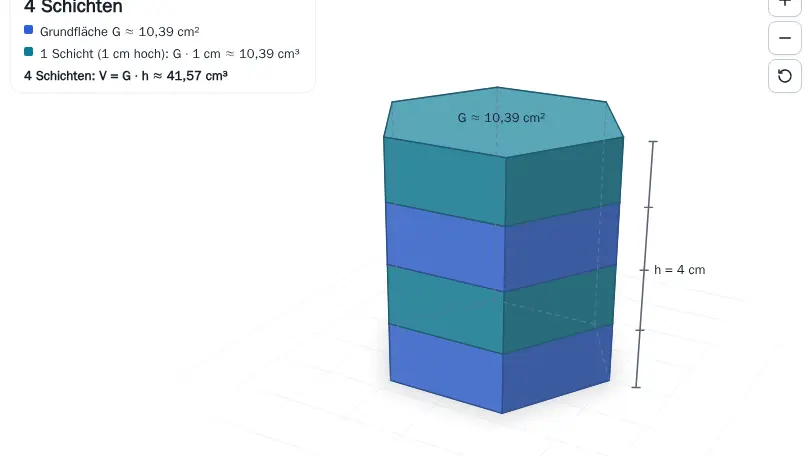
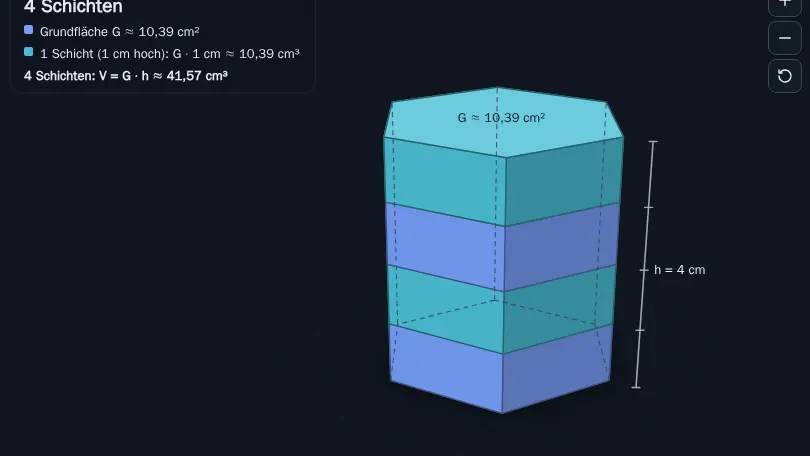
Layer by layer a prism grows upwards, and the curved surface of a cylinder unrolls into a rectangle.
Understanding volume as base times height and surface area via the net.
Layer by layer a prism grows upwards, and the curved surface of a cylinder unrolls into a rectangle.
Drawing and recognising known solids in different representations.

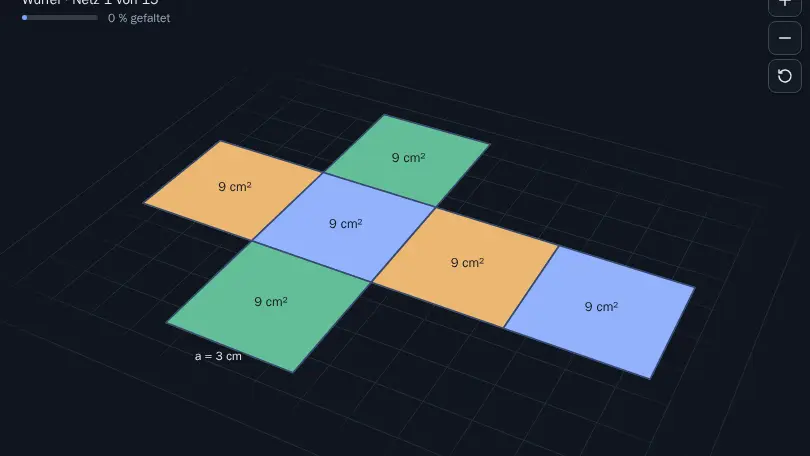
Fold nets of a cube, cuboid, prism, pyramid and cylinder into a solid in 3D and calculate the surface area.
Congruence and symmetry, Pythagorean theorem with proofs, Thales' theorem, similarity, central dilation and intercept theorems.
Defining congruence and symmetry, e.g. via congruence theorems.
Construct triangles from three given parts with ruler and compass, step by step as in your exercise book. Sometimes there are no, one or two solutions.
In a line or in a point: the shape flips over, and every construction step with the set square stays visible.
Justifying and proving the theorem and using it to calculate side lengths.
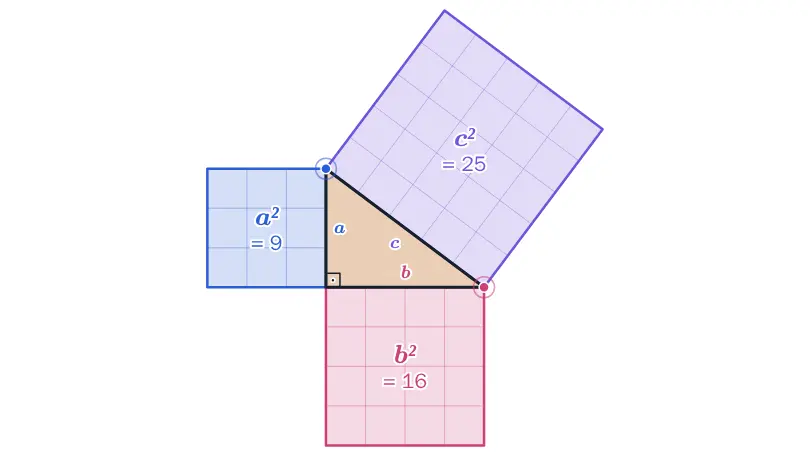

Squares on the sides of a right triangle and a puzzle proof show: a² + b² = c².
Discovering and justifying right angles in a semicircle.

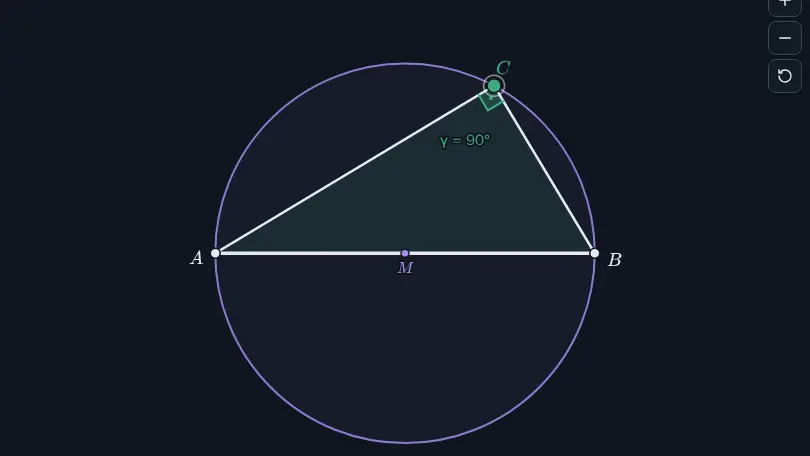
Drag a point along the semicircle: the angle there is always a right angle.
Enlarging/reducing figures to scale and calculating ratios of segments.
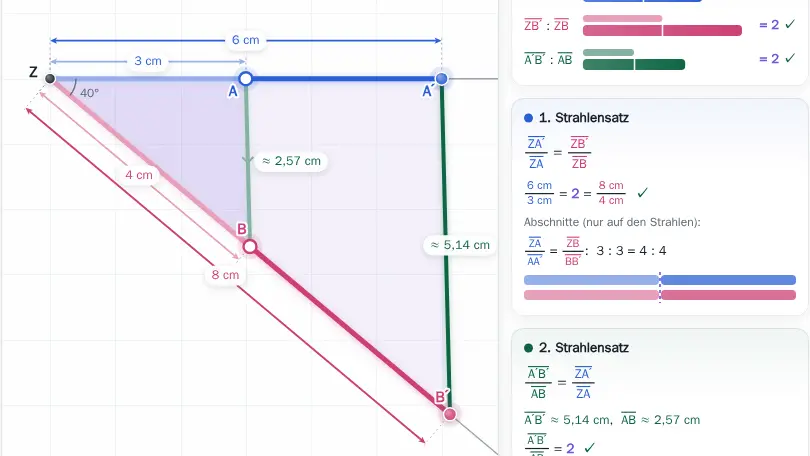
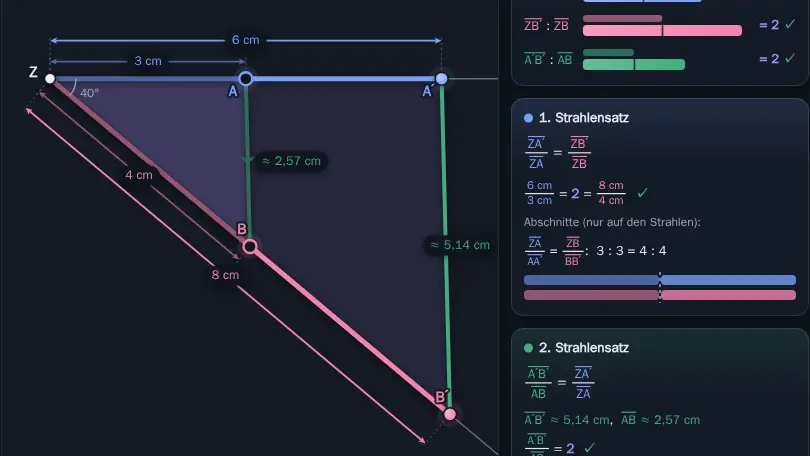
How tall is the tree without climbing it? Two rays and a parallel line are enough, because the ratios stay the same.

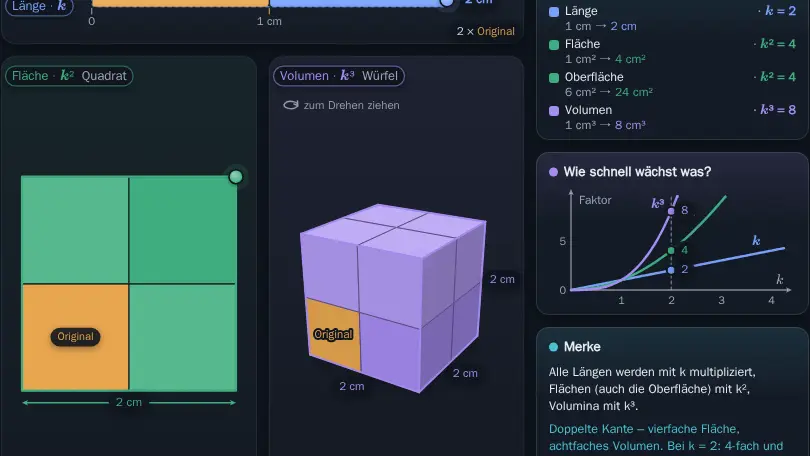
Enlarge lengths, areas and solids. Doubling the length makes the area four times and the volume eight times as large.
Working with composite figures and angle measures, and angle theorems.
Dissecting or completing areas into known component figures.
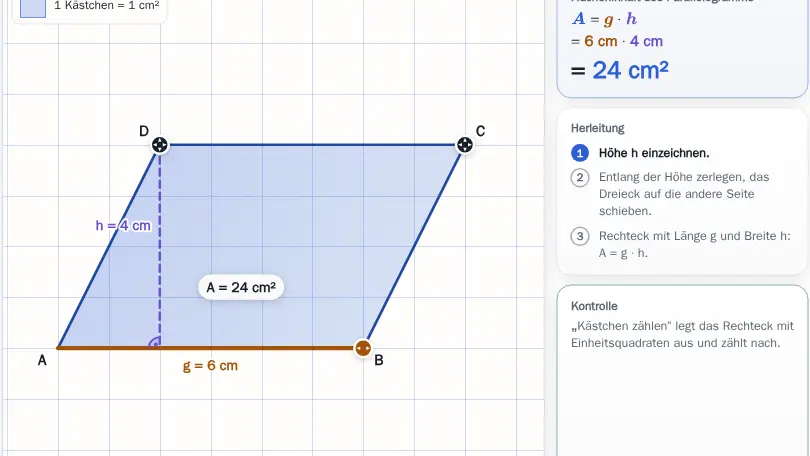
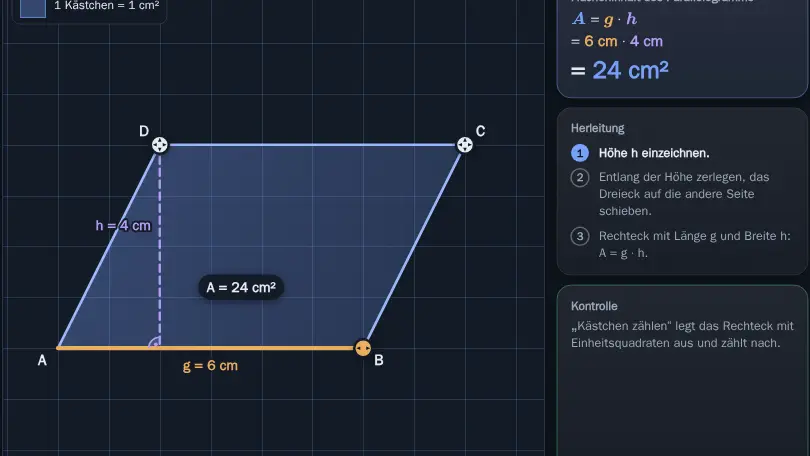
Cut off a triangle and put it on the other side: the parallelogram becomes a rectangle. Triangles and trapeziums work the same way.
Stating angles more precisely in degrees, minutes and seconds.
No separate simulation is planned for this.
Using the interior angle sum and vertical, adjacent, corresponding and alternate angles.
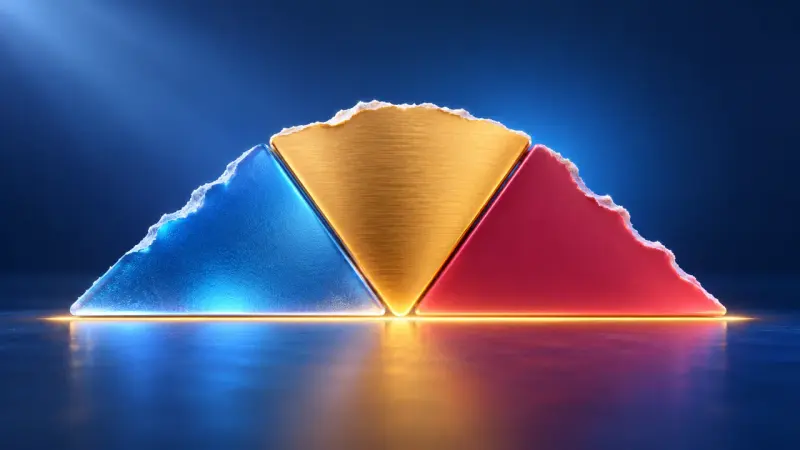
Tear off three corners, put them side by side, and you get a straight line: 180°, for every triangle. A quadrilateral gives 360°.
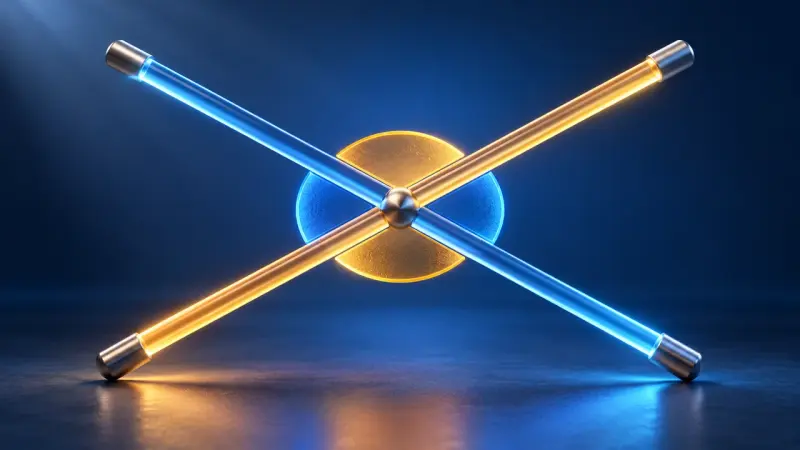
Two lines cross and one of them turns. Which angles stay equal? At parallel lines they are called corresponding and alternate angles.
Area and perimeter of further polygons and the circle, and volume and surface area of the prism.
Deriving area formulas by dissection and completion; circumference and area of the circle with π.
Cut off a triangle and put it on the other side: the parallelogram becomes a rectangle. Triangles and trapeziums work the same way.
A wheel rolls once and travels a bit more than three times its diameter. Cut into pieces, the circle becomes a rectangle and the area formula follows.
Calculating volume and surface area of prisms.
Layer by layer a prism grows upwards, and the curved surface of a cylinder unrolls into a rectangle.
Recognising proportional and inversely proportional assignments, solving them with the rule of three and representing them in text, table and graph.
Recognising and using constant quotients or constant products.
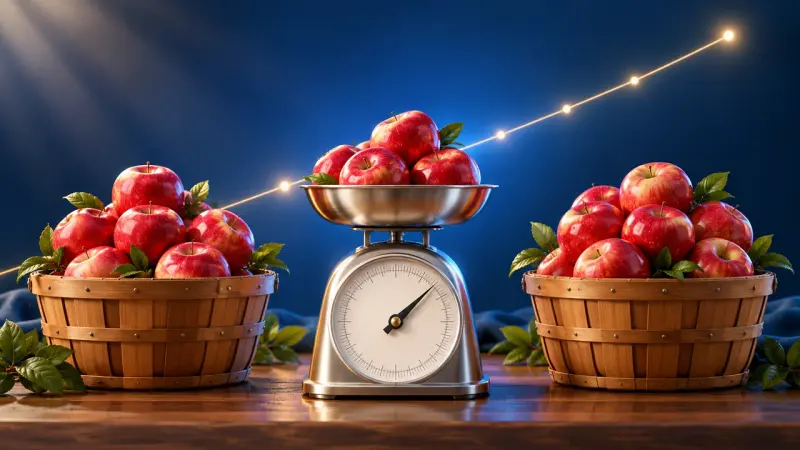
Twice as many apples cost twice as much. Picture, table and graph show together when a relation is proportional, with the rule of three.

The hyperbola gets ever closer to its asymptotes and yet never touches them. Shifting and stretching show what the parameters do.
Calculating missing values step by step via one unit.
Twice as many apples cost twice as much. Picture, table and graph show together when a relation is proportional, with the rule of three.
Switching between text, table of values and graph.
Twice as many apples cost twice as much. Picture, table and graph show together when a relation is proportional, with the rule of three.

Exactly one y for every x? The arrow diagram, table and graph tell you straight away whether a relation is a function.
Solving linear equations and inequalities, comparing solution methods and investigating linear functions and their properties.
Solving equations by equivalent transformations.

Solve linear equations on a balance: whatever you do to both sides keeps the scale balanced.
Contrasting trial-and-error, algebraic transformation and graphical solution.
Solve linear equations on a balance: whatever you do to both sides keeps the scale balanced.
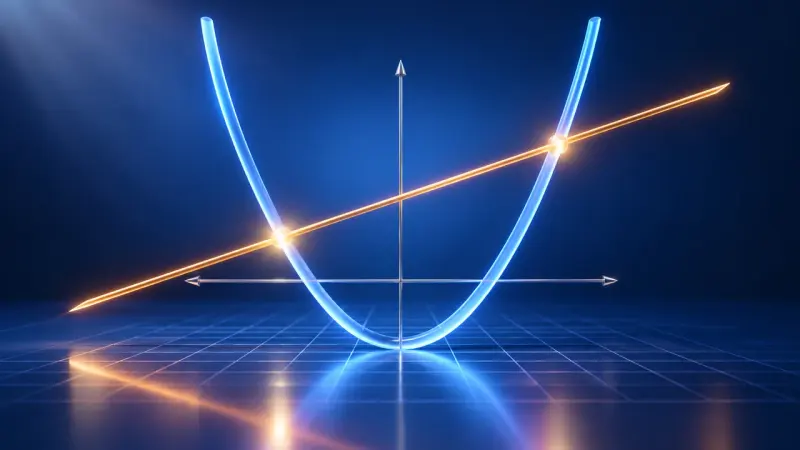
Draw both sides of an equation as graphs. The solutions are where the graphs cross.
Interpreting slope and y-intercept and drawing graphs.

Change the slope and the y-intercept of a line and read off the slope triangle and the zero.
Solving linear inequalities and stating solution sets.
No separate simulation is planned for this.
Presenting data in box plots, bar and pie charts and assessing them with measures of centre and spread.
Choosing, creating and critically reading a suitable type of diagram.

One outlier pulls the mean away while the median barely moves. Dragging single data points shows which value is how robust.

Show the same data as bar, line and pie charts and more, and discover how charts can mislead.
Determining and comparing mean, median, quartiles and range.
One outlier pulls the mean away while the median barely moves. Dragging single data points shows which value is how robust.
Describing and calculating two-stage random experiments with tree diagrams, two-way tables and path rules.
Investigating experiments with two steps and counting outcomes.

How many outfits or ice cream combinations are there? A tree diagram grows step by step and shows why you multiply the options.

Draw balls from an urn, with or without replacement. The tree diagram and the path rules show how to calculate probabilities.
Representing probabilities in tree diagrams and two-way tables.
Draw balls from an urn, with or without replacement. The tree diagram and the path rules show how to calculate probabilities.
Applying the product and sum rules.
Draw balls from an urn, with or without replacement. The tree diagram and the path rules show how to calculate probabilities.
The summaries describe the curriculum in our own words. The original text is authoritative. Original text (German): Kerncurriculum, Gymnasium, Mathematics, grade 7/8