

Place value and rounding
Ten counters make a ten, ten tens make a hundred. Once you have seen the bundling, reading millions and rounding them is no longer a mystery.
Mathematics & Physics
Explore mathematics and physics with interactive simulations – in the classroom and at home. Free, with no sign-up required.
Physics / Mechanics
Two loops, airtime and up to 80 km/h: change the starting height and friction or build your own track. Is there enough energy to make it all the way?
Preparing the experiment …
Height of the track points
Before starting, drag the car up or down. Tap the rail to add measuring points.
Open the full energy simulation ↗129 of 129 simulations
Ten counters make a ten, ten tens make a hundred. Once you have seen the bundling, reading millions and rounding them is no longer a mystery.

A frog hops past zero into the negatives. Thermometers and bank balances show why minus 3 plus 5 makes exactly 2.

Break numbers down into prime factors, check divisibility rules and find primes with a sieve. This also gives you the gcd and the lcm.

From a grain of sand to the Earth in steps of ten. Along the way it becomes clear why 10⁶ is a million and how to write tiny numbers.
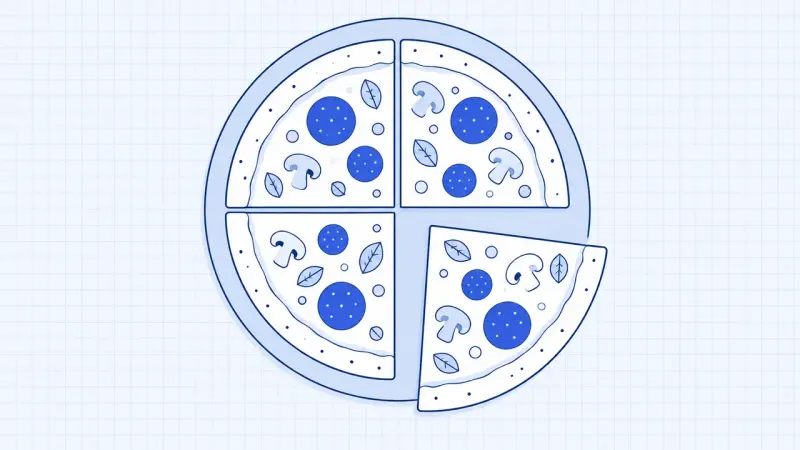
Pizza, cake or a line: share it out fairly first, then colour some pieces. That is exactly what a fraction means.

Compare two fractions as bars or circles. When you expand a fraction, the pieces get smaller but the amount stays the same.

Why does 1/4 end as a decimal but 1/3 never does? Long division gives it away as soon as a remainder repeats.

Two strips overlap in a rectangle: the shared area is the product of the fractions. Dividing by a fraction is shown visually as well.

Discounts, VAT, surveys: one single bar holds the base value, the percentage and the part, one above the other.

Step by step, a rectangle turns into a square with the same area. The method is almost 2000 years old and reaches √2 surprisingly quickly.

An expression drawn as a tree: whatever hangs lowest is calculated first. The order of operations stops being a rule and becomes visible.

The three binomial formulas as areas: a square splits into smaller squares and rectangles.

Solve linear equations on a balance: whatever you do to both sides keeps the scale balanced.
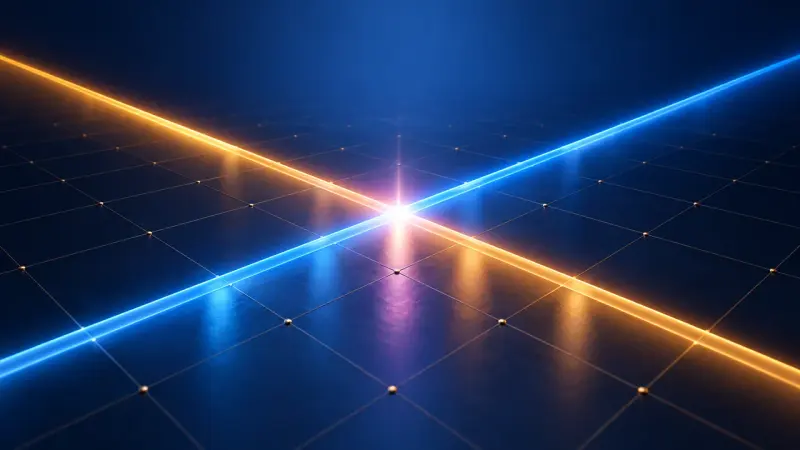
Two equations are two lines. Their point of intersection is the solution, which you can read off and check.
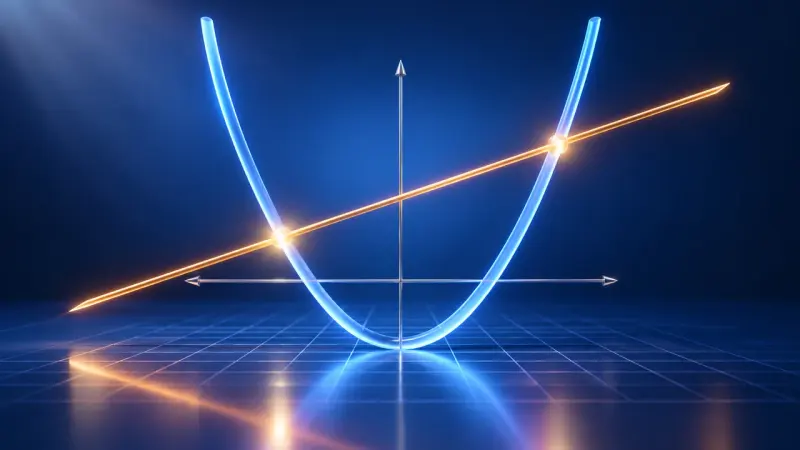
Draw both sides of an equation as graphs. The solutions are where the graphs cross.
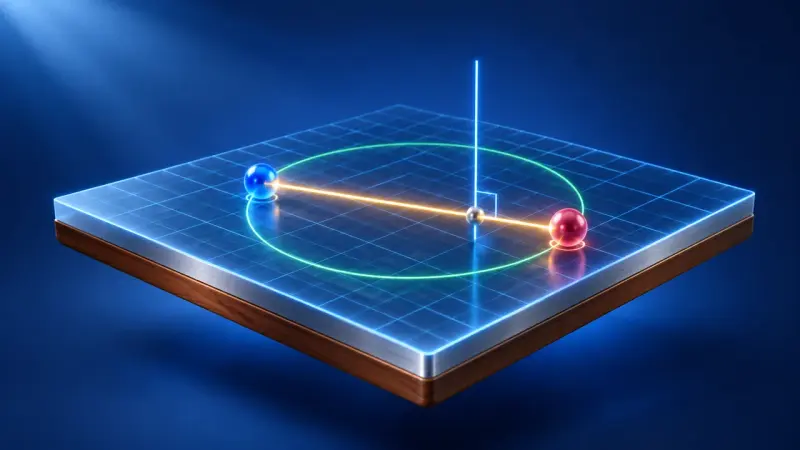
Place and read points in a coordinate system, draw segments and lines and check whether they are parallel or perpendicular.

Line up the protractor, hit the zero point, read the right scale. The estimation game then shows how well your eye already measures.

Move one corner and the square becomes a kite. When does a quadrilateral get which name?

In a line or in a point: the shape flips over, and every construction step with the set square stays visible.

A point equally far from A and B never lies there by chance: the perpendicular bisector appears before you draw it with compasses.
Two lines cross and one of them turns. Which angles stay equal? At parallel lines they are called corresponding and alternate angles.
Tear off three corners, put them side by side, and you get a straight line: 180°, for every triangle. A quadrilateral gives 360°.
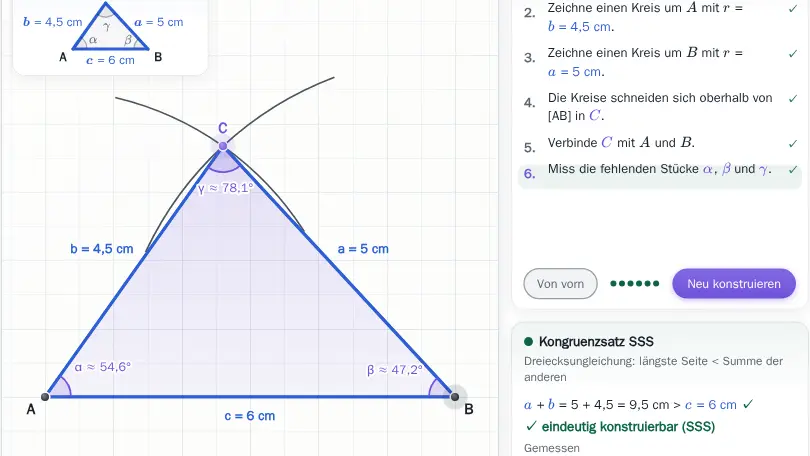
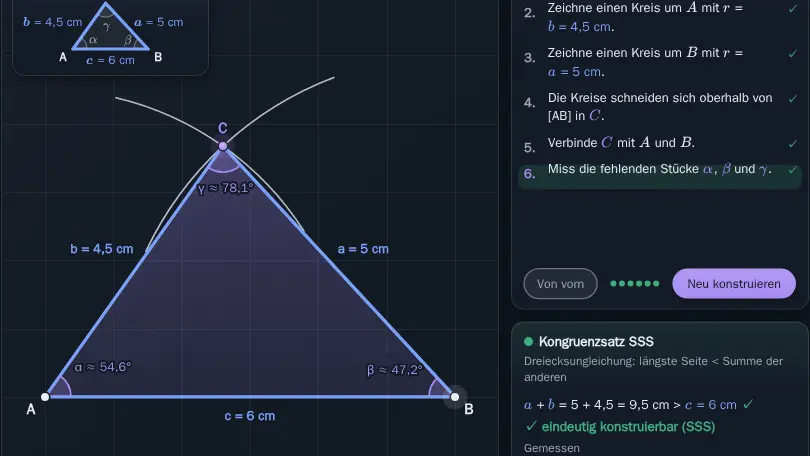
Construct triangles from three given parts with ruler and compass, step by step as in your exercise book. Sometimes there are no, one or two solutions.
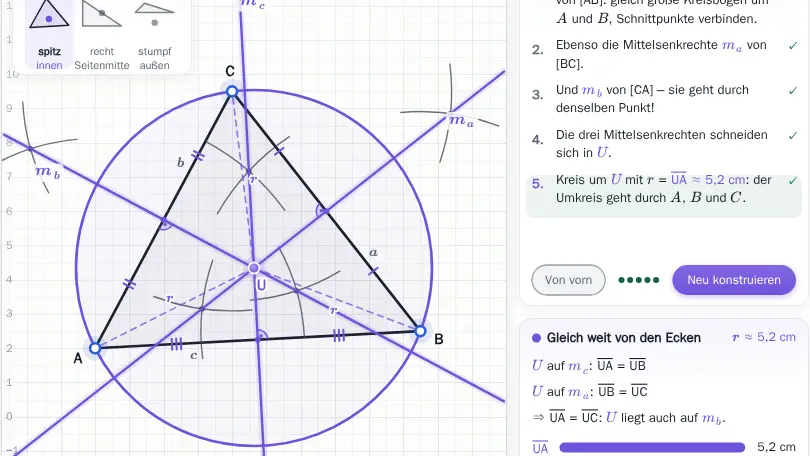

Construct the special lines in a triangle. Each set of three always meets in one point, for example at the centre of the circumcircle or the incircle.

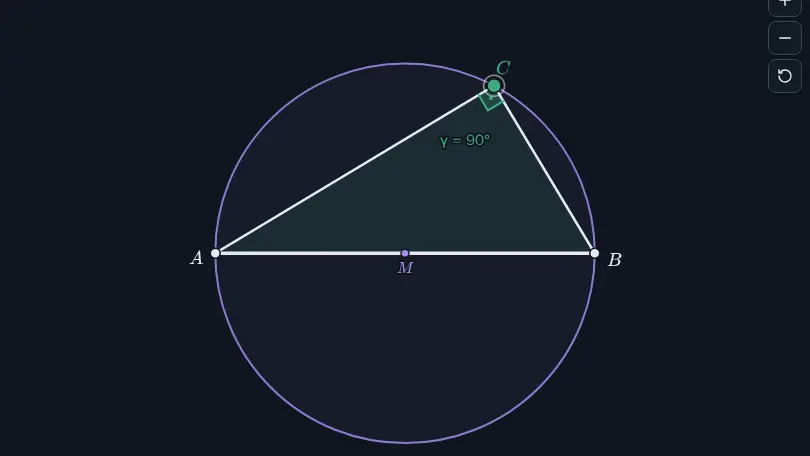
Drag a point along the semicircle: the angle there is always a right angle.
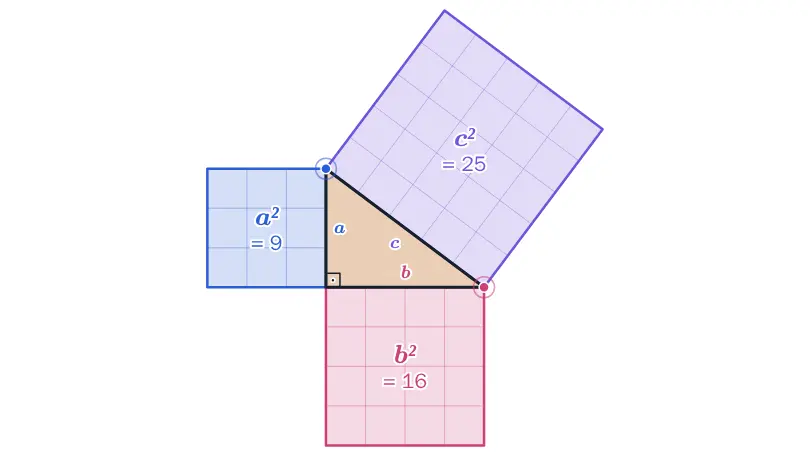

Squares on the sides of a right triangle and a puzzle proof show: a² + b² = c².
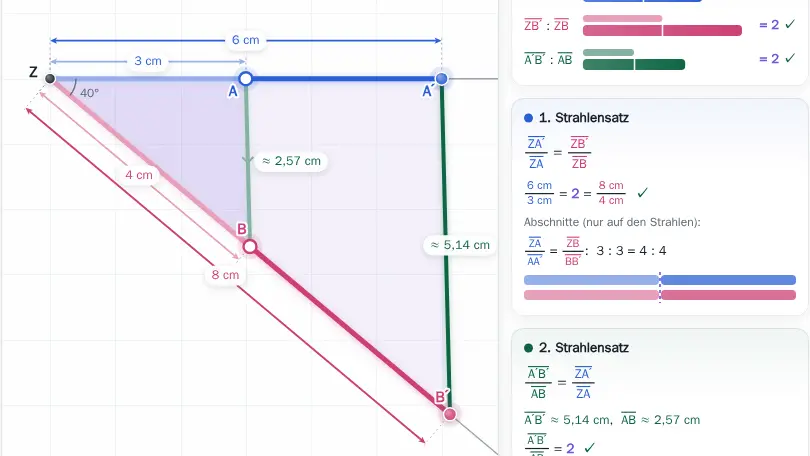
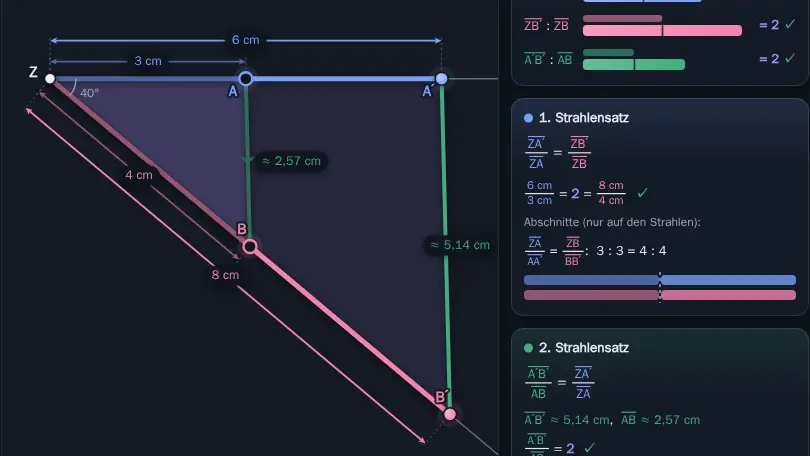
How tall is the tree without climbing it? Two rays and a parallel line are enough, because the ratios stay the same.

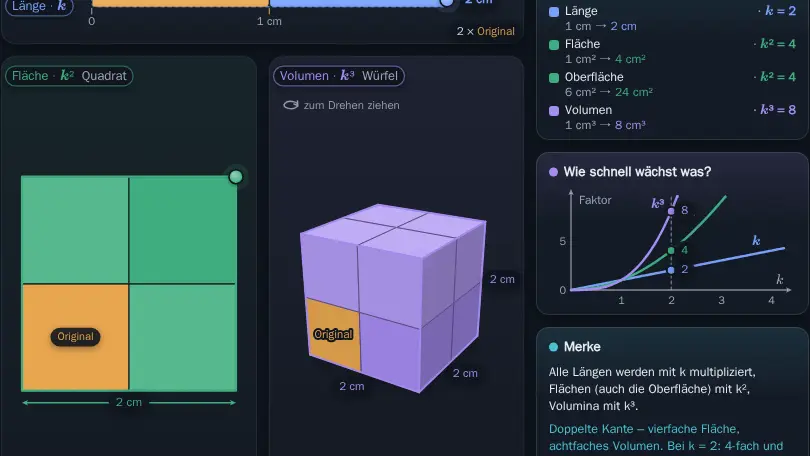
Enlarge lengths, areas and solids. Doubling the length makes the area four times and the volume eight times as large.

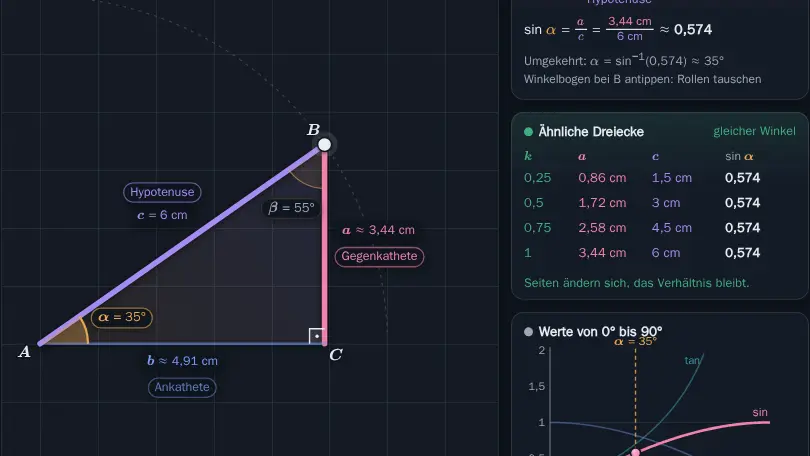
In a right triangle, the ratio of two sides depends only on the angle. This gives sine, cosine and tangent, with examples such as ramps and ladders.

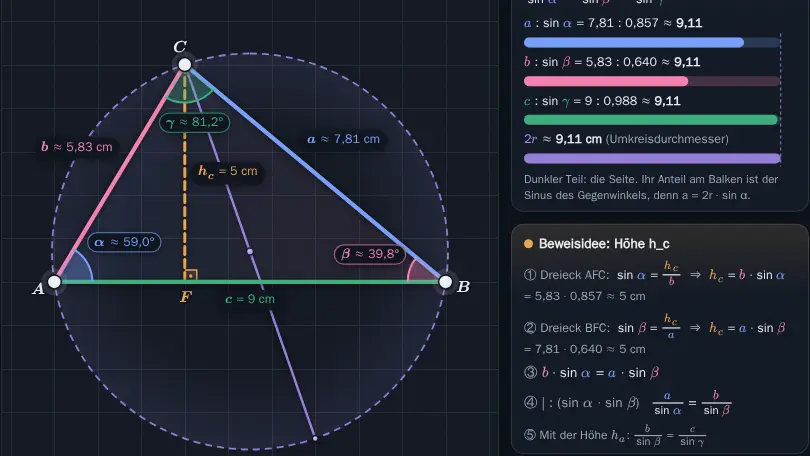
Calculate sides and angles in any triangle with the law of sines and the law of cosines. A helper shows which law fits your problem.

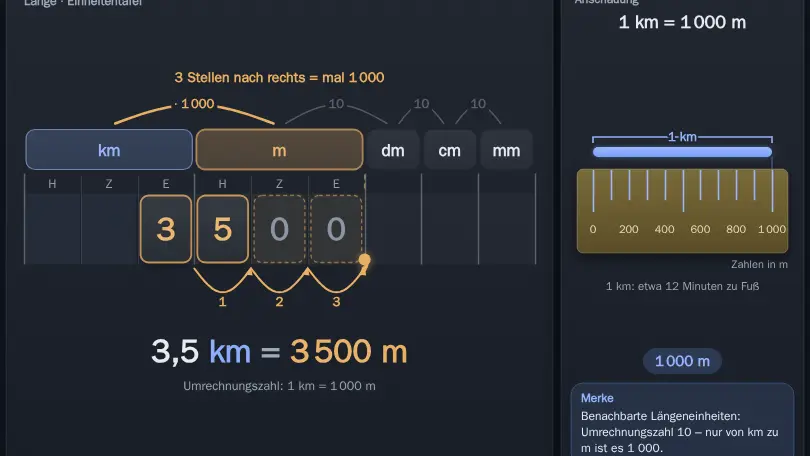
3.5 km is 3500 m, but 3.5 m² is 35,000 cm². The unit table shows why the decimal point jumps twice as far for areas.
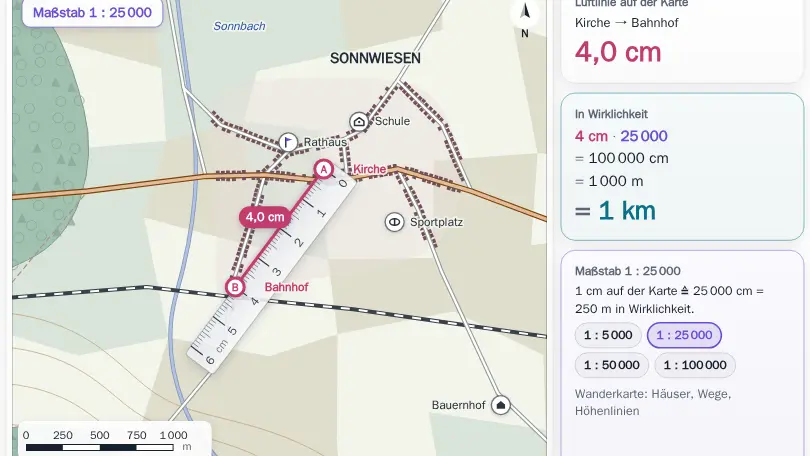

Measure on a map with a ruler and use the scale to work out the real distance.
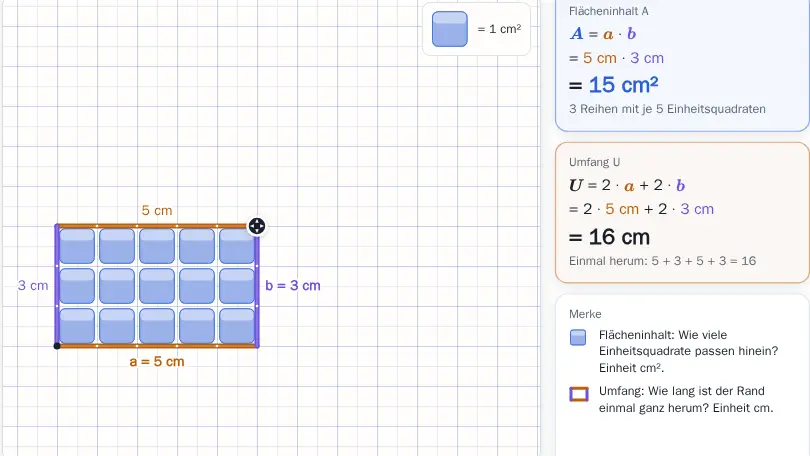

Count the squares or walk once around? An ant makes the difference between area and perimeter tangible.
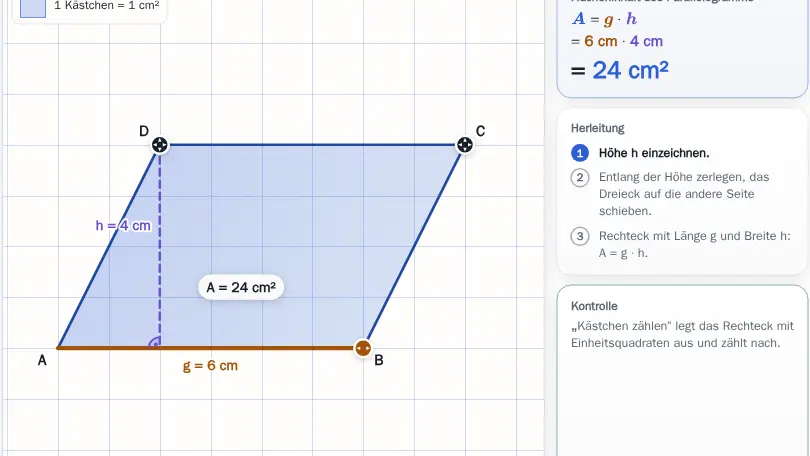
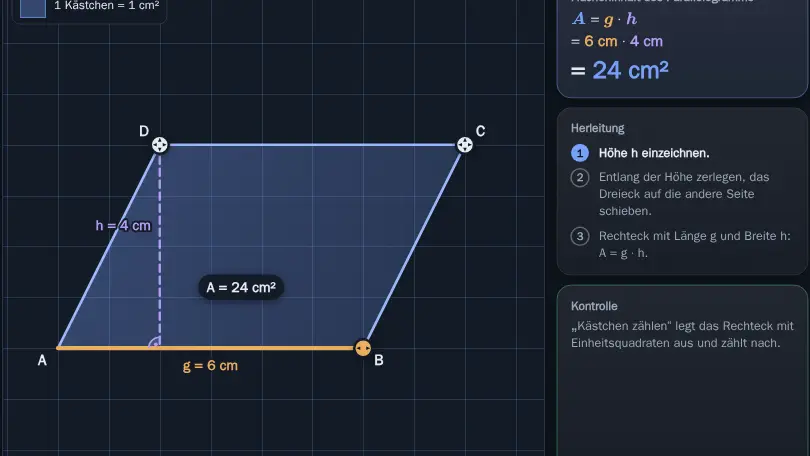
Cut off a triangle and put it on the other side: the parallelogram becomes a rectangle. Triangles and trapeziums work the same way.

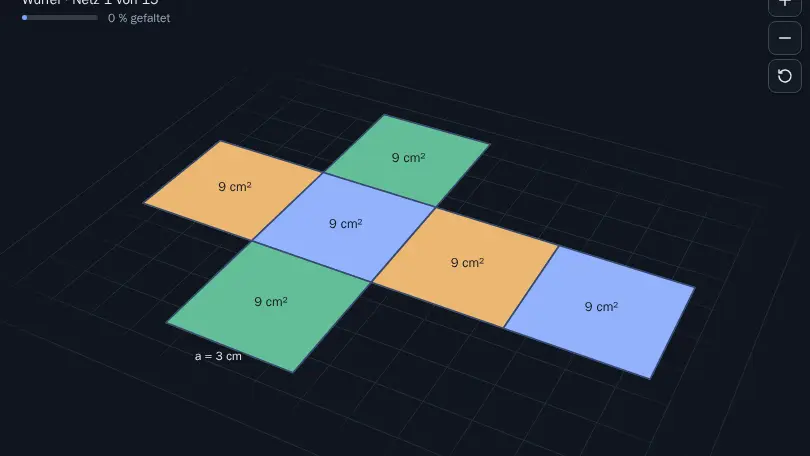
Fold nets of a cube, cuboid, prism, pyramid and cylinder into a solid in 3D and calculate the surface area.
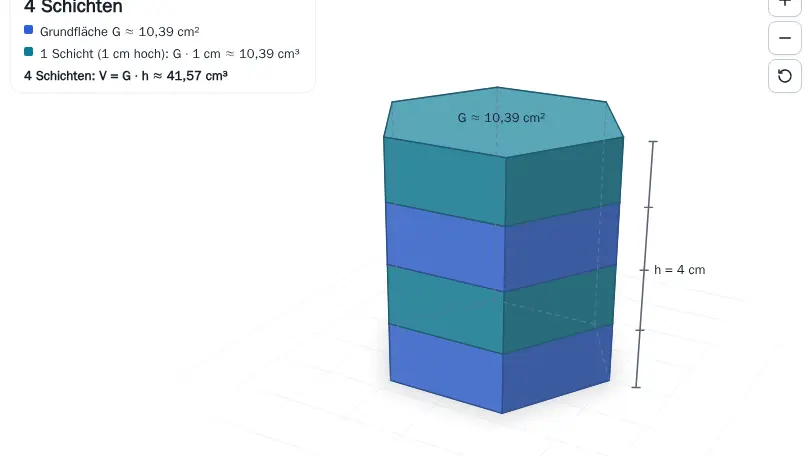
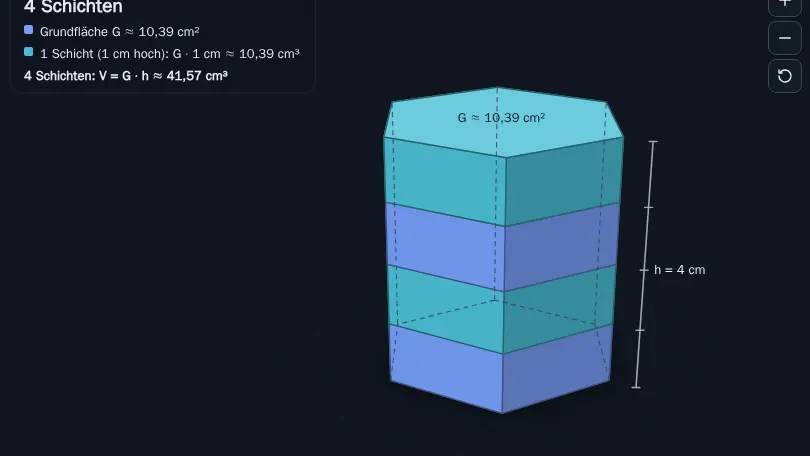
Layer by layer a prism grows upwards, and the curved surface of a cylinder unrolls into a rectangle.

Pour three times and the prism is full: a pyramid holds exactly one third. Cones and spheres can be turned and measured in 3D.

Push a stack of coins sideways: the shape changes, but the volume stays the same. This is Cavalieri's principle.
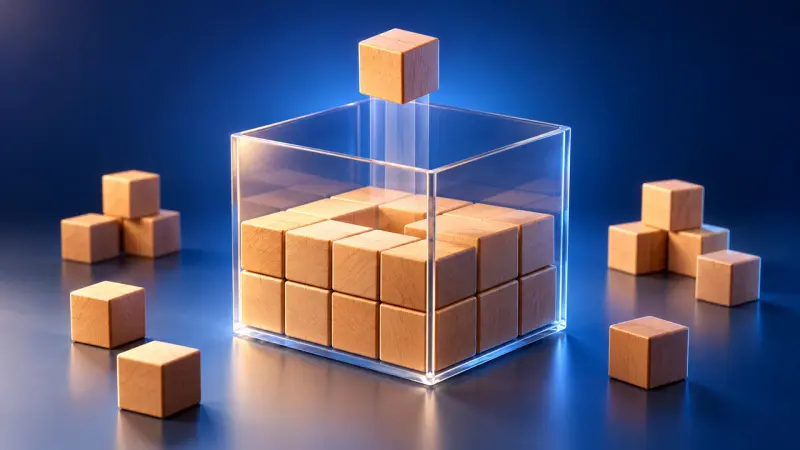
First a row of cubes, then a layer, then the whole cuboid. Length times width times height follows naturally from filling it.
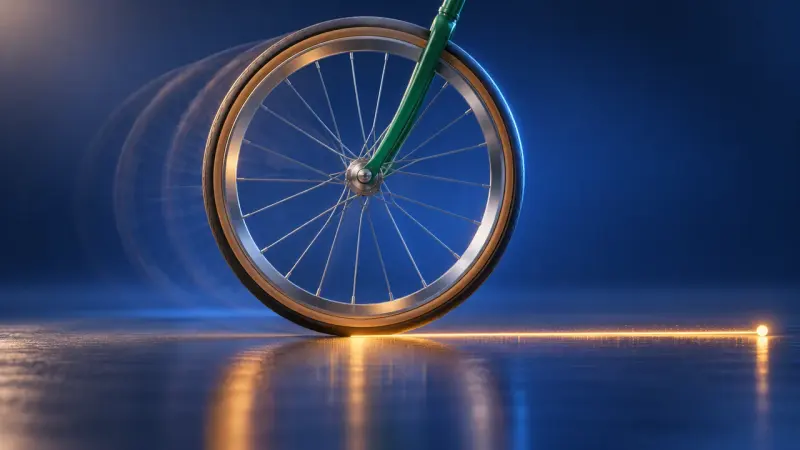
A wheel rolls once and travels a bit more than three times its diameter. Cut into pieces, the circle becomes a rectangle and the area formula follows.
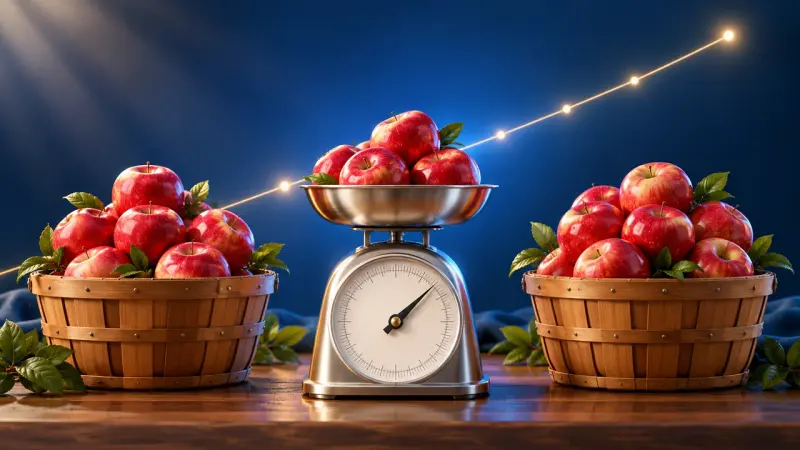
Twice as many apples cost twice as much. Picture, table and graph show together when a relation is proportional, with the rule of three.

Exactly one y for every x? The arrow diagram, table and graph tell you straight away whether a relation is a function.
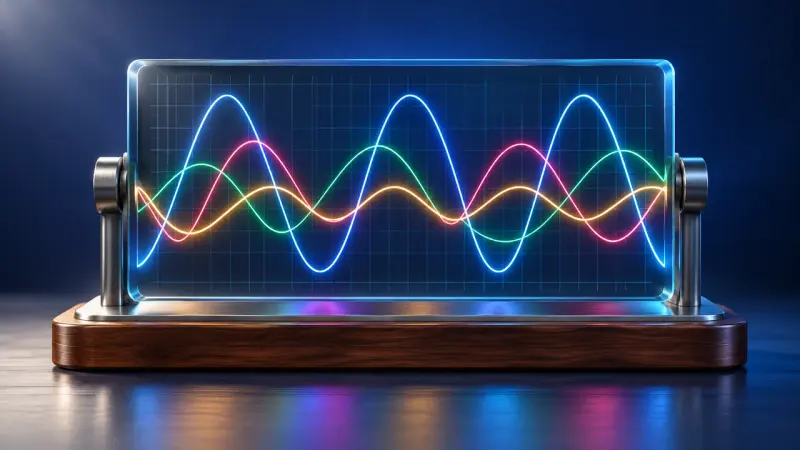
Up to three of your own functions at once, with a table of values, zeros and intersections. The tool for anything that can be a graph.

Change the slope and the y-intercept of a line and read off the slope triangle and the zero.

The hyperbola gets ever closer to its asymptotes and yet never touches them. Shifting and stretching show what the parameters do.
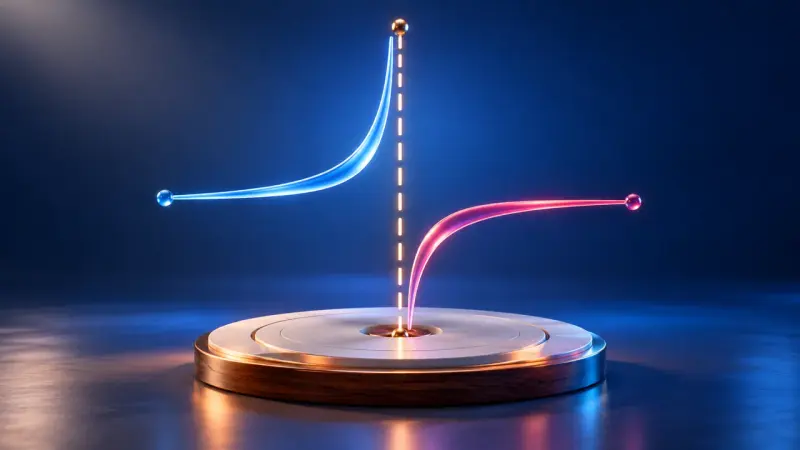
A zero or a pole, a hole or a leap to infinity? Drag the terms of the fraction and the graph shows the difference.

Stretch, reflect and shift parabolas and read off the vertex and the zeros.

Drag three points and the matching parabola always passes through all of them. The equation is worked out step by step.

Which enclosure has the largest area? Picture and graph show the maximum, first by trying, then by exact calculation.
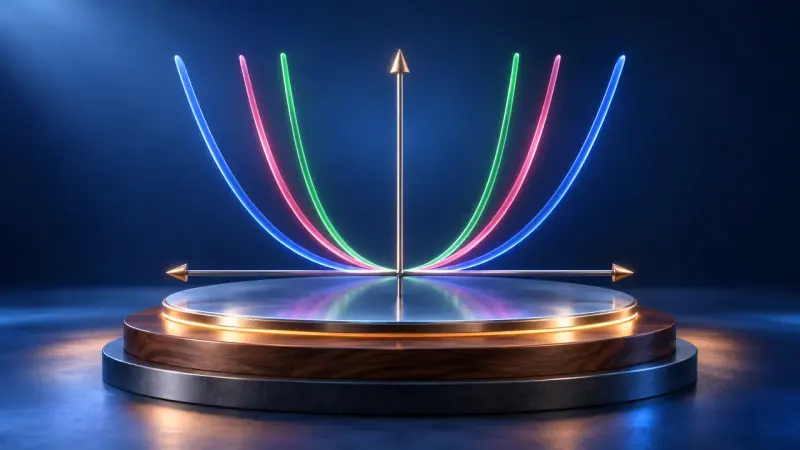
Even or odd, positive or negative: y = a · xⁿ changes with every exponent, and only a few points always stay the same.

Sine, cosine and tangent on the unit circle, and how the sine curve grows out of it.
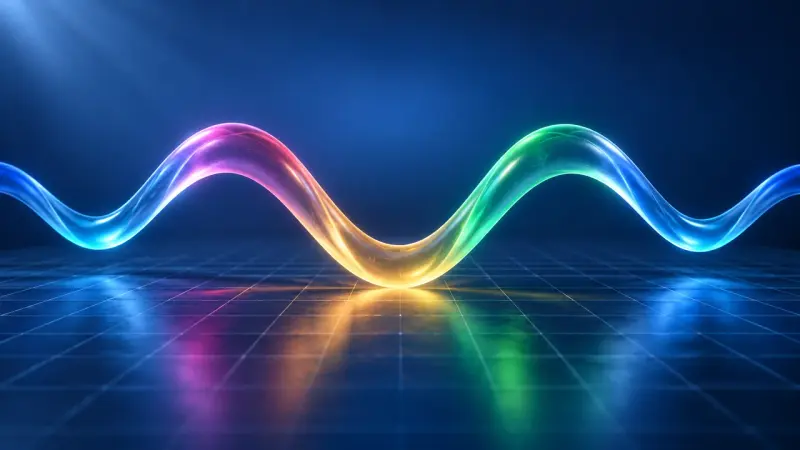
Change the amplitude, period and shift of a sine curve with sliders or by dragging.
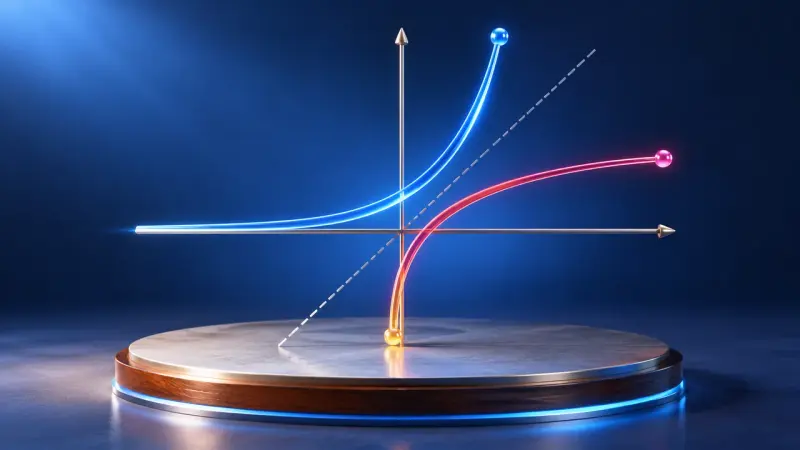
The logarithm answers the question: to what power do I raise the base to get this number? With graphs, rules and exponential equations.

Water lilies on a pond, compound interest and decay: exponential growth compared with linear growth.
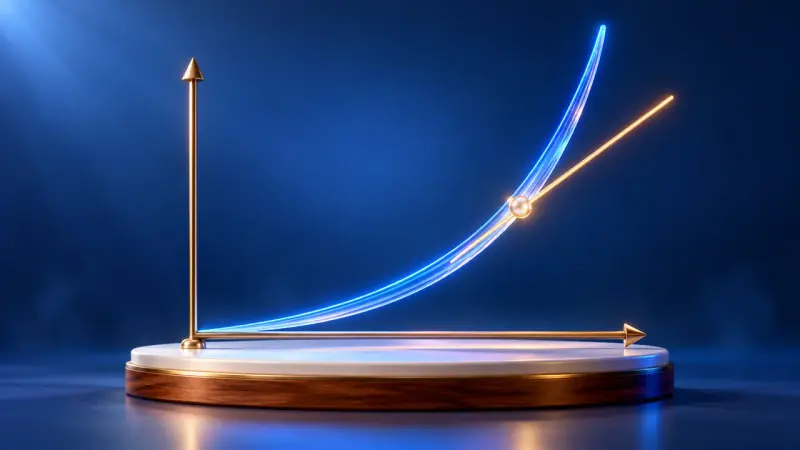
Why is the number e so special? For the exponential function, the graph and its derivative are exactly the same.
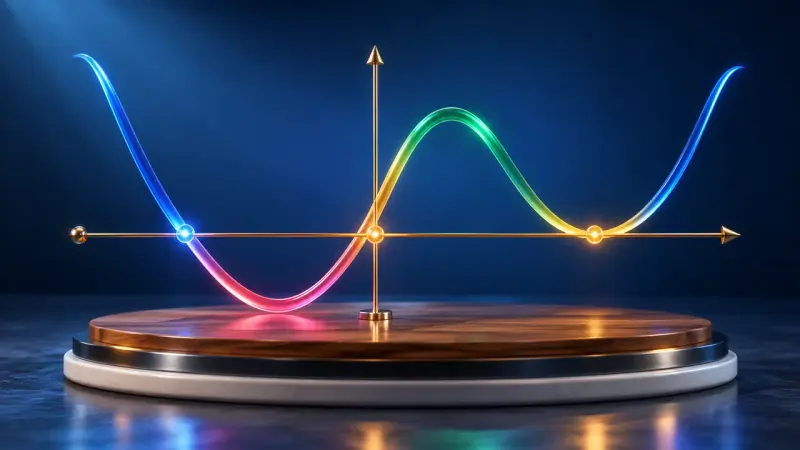
Does the graph cross the x-axis or only touch it? The multiplicity of the zero decides, the highest power decides what happens far out.
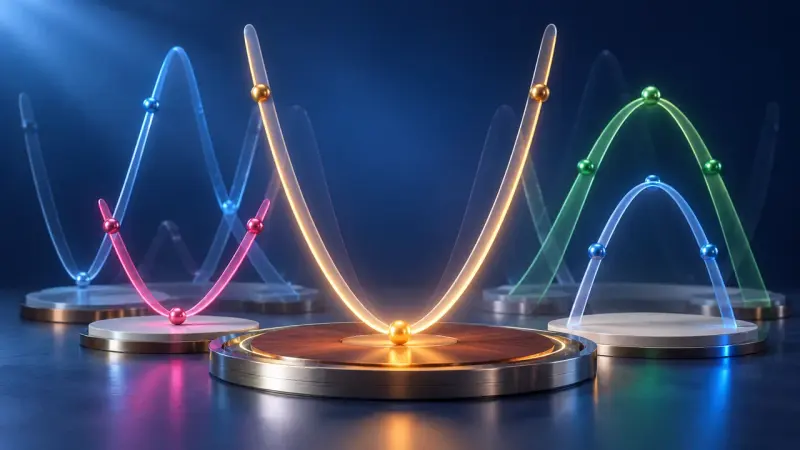
Shift, stretch, reflect: every move of the graph leaves its mark in the function's equation.
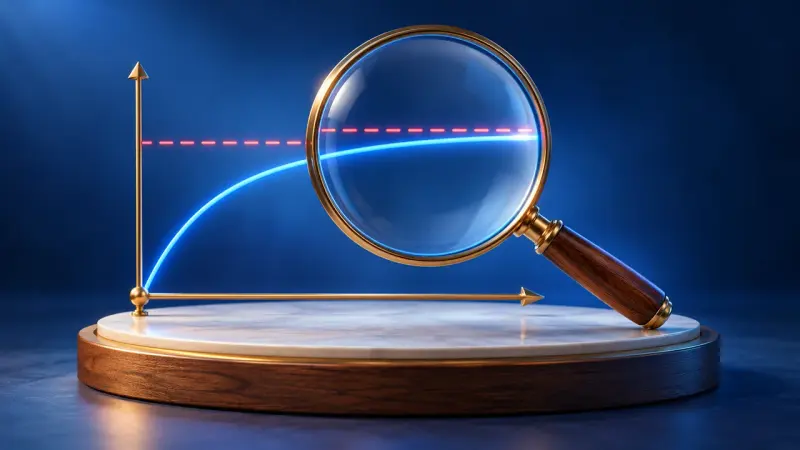
What happens to a graph when x gets very large? A point runs outwards and a magnifier shows how close it gets to the asymptote.
Reflect the graph in y = x and the inverse function appears. It only works if no function value occurs twice.

How many outfits or ice cream combinations are there? A tree diagram grows step by step and shows why you multiply the options.
Show the same data as bar, line and pie charts and more, and discover how charts can mislead.

One outlier pulls the mean away while the median barely moves. Dragging single data points shows which value is how robust.

Toss a coin, a die or a drawing pin a thousand times: the more often you throw, the closer the relative frequency gets to the probability.

Draw balls from an urn, with or without replacement. The tree diagram and the path rules show how to calculate probabilities.
How likely is it that two people in a class share a birthday? From just 23 people on, it is more likely than not.
Random points fall on a square with a circle inside. From the share inside the circle you can estimate π.

Play yourself or simulate thousands of games: is it worth switching doors?

A two-way table, a Venn diagram and a tree diagram show the same data and are linked. Change one and the others follow.

A medical test is positive, but how likely is it that you are really ill? 1000 people show why the answer is often surprising.

Left or right at every pin, purely by chance. Yet every time the balls pile up into the same bell shape.
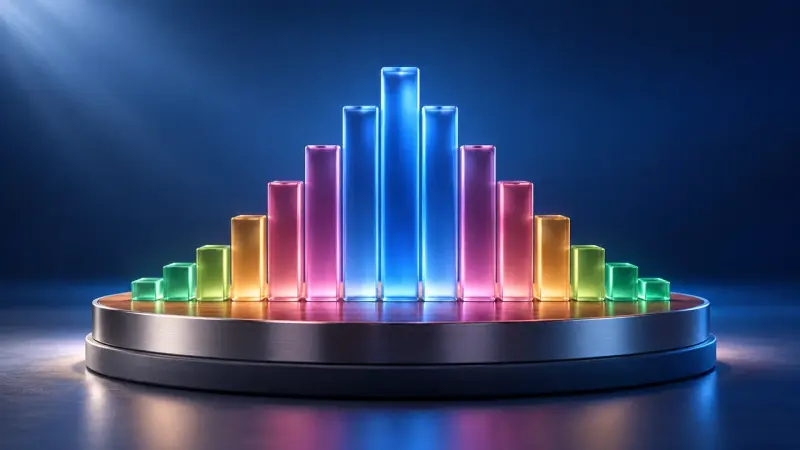
The histogram of the binomial distribution: choose a range and read off the probability directly.
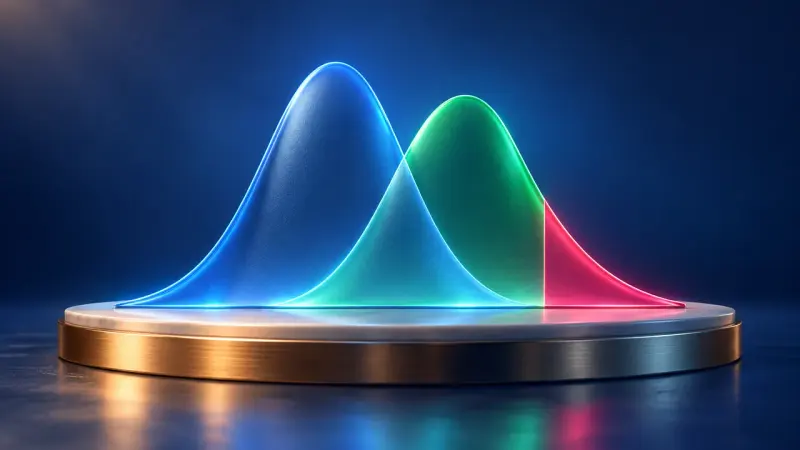
A test decides between two hypotheses. Coloured areas show how often it can be wrong.
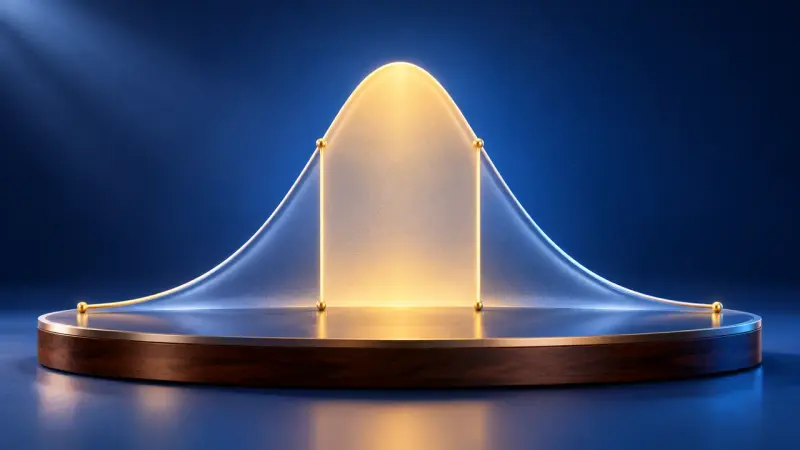
How many bottles are underfilled? Under the bell curve every probability is an area, with the sigma rules as a rule of thumb.
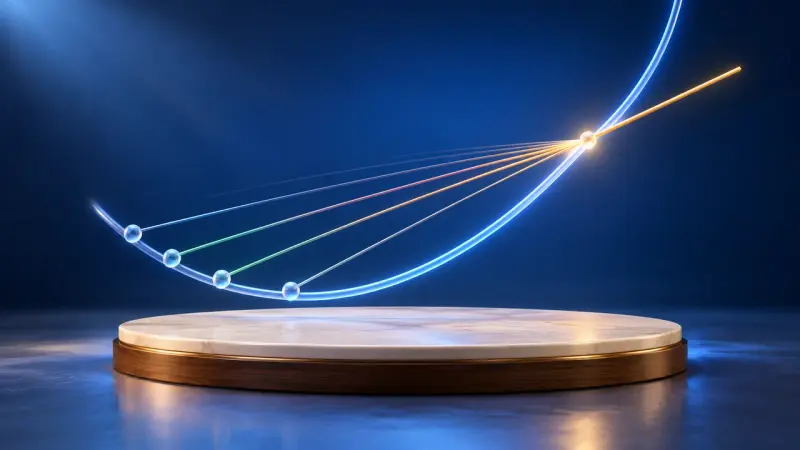
Let a point Q move towards P: the secant becomes the tangent, and the average slope becomes the derivative.

A tangent slides along the graph and draws its slope as a new graph: the derivative function.

Approximate a zero with tangent lines. Each step gets you closer, but sometimes it goes wrong.
Analyse a graph step by step: zeros, maximum and minimum points, inflection points and where it rises or falls.

Which box holds the most, which can uses the least metal? Five everyday problems show how to find the best solution with the derivative.

One parameter, infinitely many graphs. Where do the maxima go as k grows? Along a curve of their own, the locus.
The height of one graph becomes the slope of another. If you understand bank balances, the antiderivative comes quicker than you think.

Fill the area under a graph with rectangles. The more rectangles, the more precisely you get the value of the integral.
The area under a graph grows as you move along. Its rate of change is exactly the function itself: this is the fundamental theorem.

From the speed of a car you get the distance travelled: the area under the curve shows the total change.
The area under a graph rotates about the x-axis and becomes a solid. Its volume is calculated with thin discs.
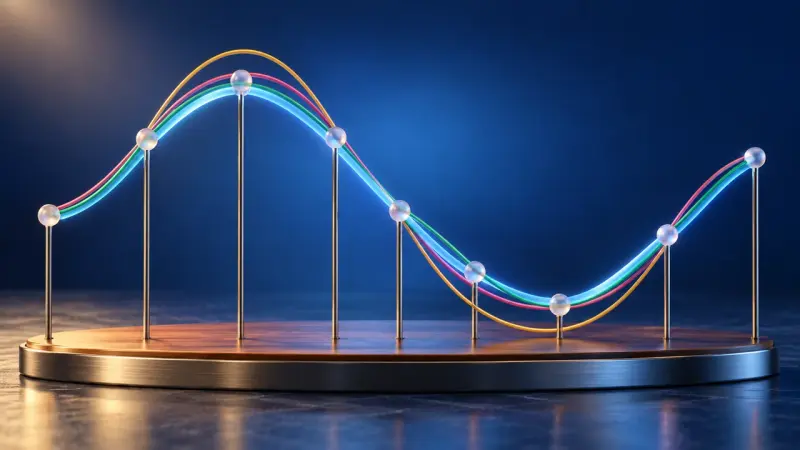
Term by term a polynomial hugs a function such as sin x ever more closely. That is pretty much how a calculator does it.
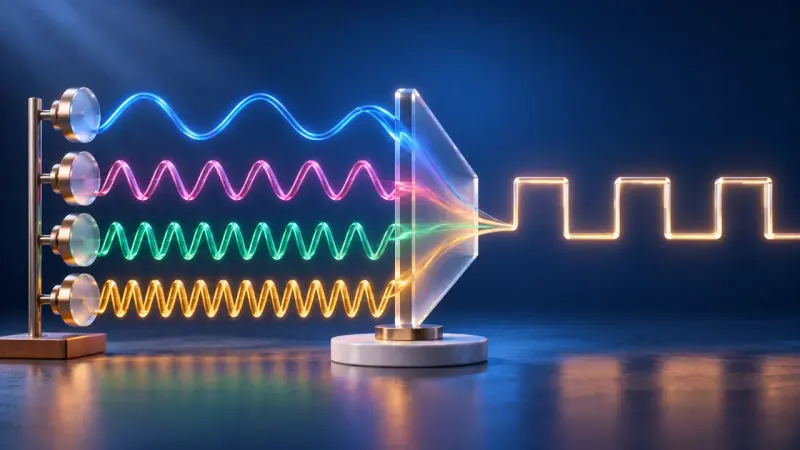
Square, sawtooth and other waves are built from many sine waves. You can also listen to them.
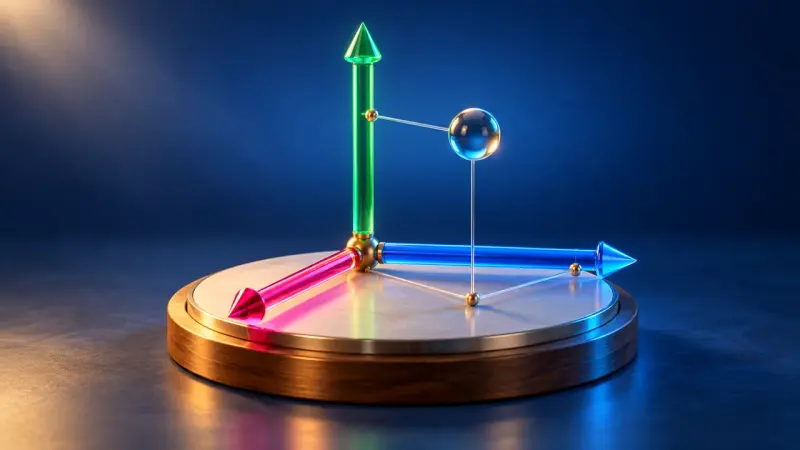
Place points in 3D coordinates, rotate the view and calculate distances with Pythagoras' theorem.

Drag vector arrows in space, add them and multiply them by numbers. The calculation is shown alongside in column form.
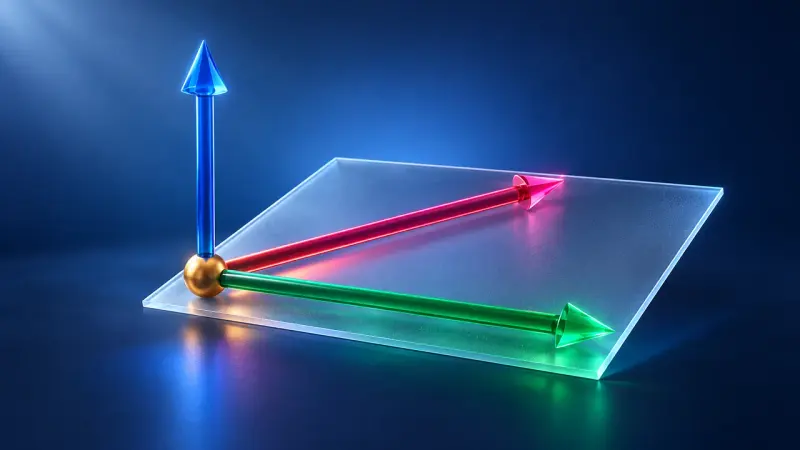
The dot product tells you the angle between two vectors; the cross product gives a perpendicular vector and an area.
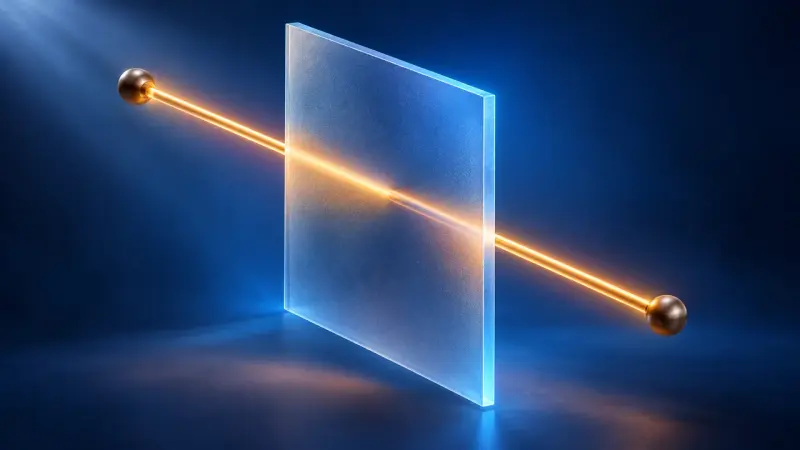
A point travels along a line through space, two vectors span a plane. Parametric, normal and coordinate forms all describe the same thing.
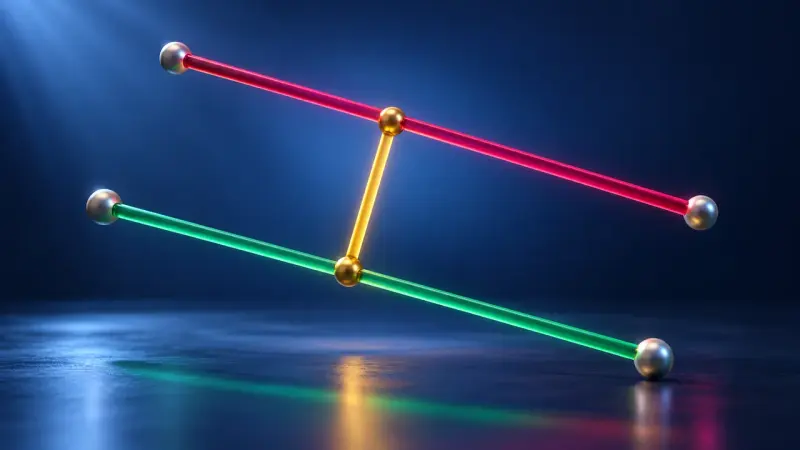
Do the lines meet, run parallel or pass each other by? In a 3D space you can turn, intersections, angles and distances become visible.

A plane cuts the sphere in a circle, touches it at a point or misses it entirely. Including the equation of the sphere and the tangent plane.

Two arrows decide everything: wherever they point, the matrix rotates, stretches or reflects the whole grid.

A car drives at a steady speed or speeds up. The graphs for distance, speed and acceleration are drawn live.

A ball falls on Earth, the Moon or Mars and gets faster every second. In a vacuum even a feather keeps up.

Hang weights on a spring and measure how far it stretches. Double the force means double the stretch.

How can a child lift an adult on a seesaw? With the longer arm. Wheelbarrows and bottle openers use the same trick.

Two forces pull on one point. Use the parallelogram of forces to find the total force or to split a force into two.

A block sits on a slope. At what angle does it start to slide? The weight is split into two parts to find out.
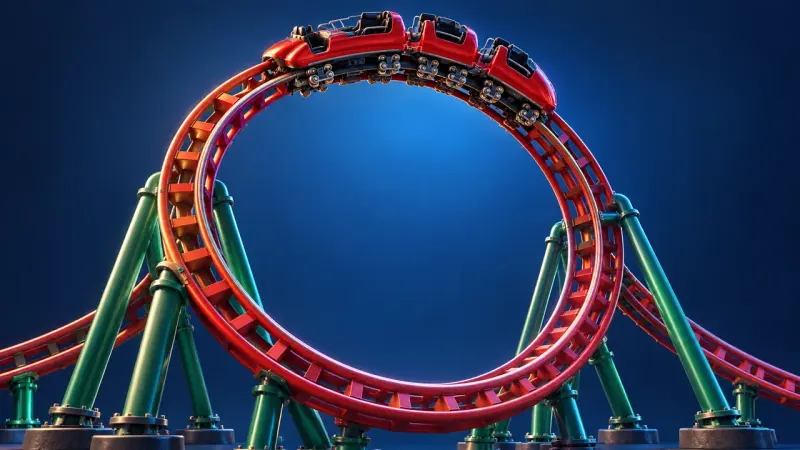
A car rides a roller coaster: energy bars show how potential and kinetic energy turn into each other.

Two gliders collide on an air track. Before and after are compared to see what stays the same.

A ball swings round on a string, a car drives through a bend. Which force keeps them on a circular path?

Too fast and the planet flies off, never to return. A little slower and it traces an ellipse around the Sun, exactly as Kepler's laws say.

Which launch angle goes furthest? On Earth it is 45°, and on the Moon the same ball flies six times as far.
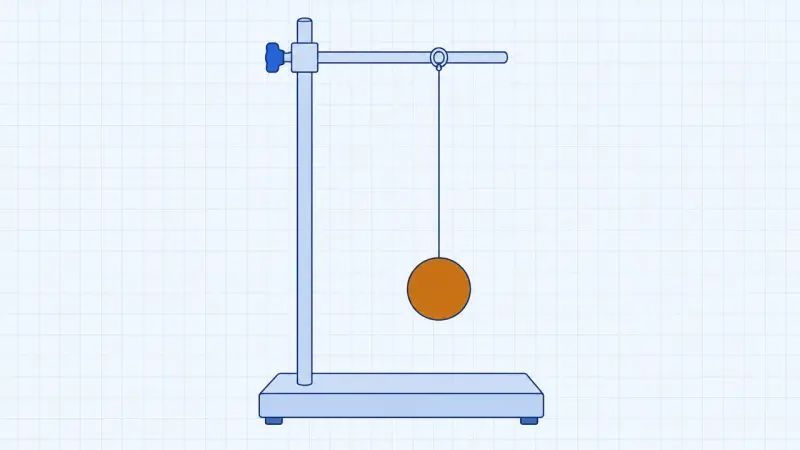
Pull a pendulum aside, let it go and measure how long one swing takes. What does it depend on? Also with large angles and damping.

A mass bounces up and down on a spring. Graphs show position, speed and energy during the oscillation.
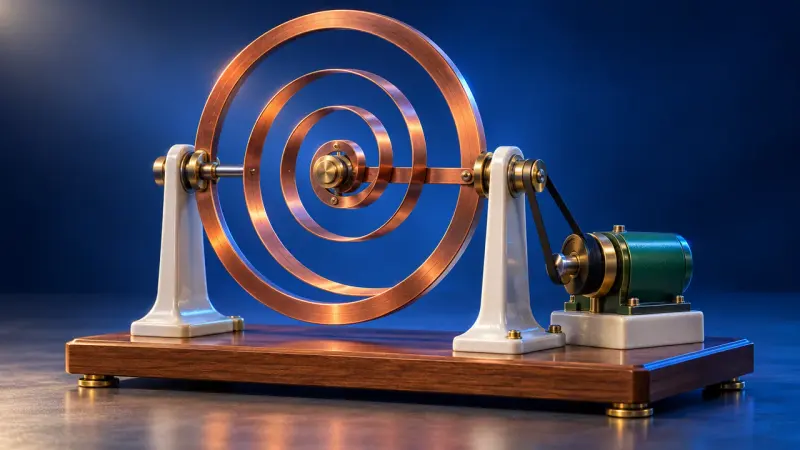
A motor drives an oscillating wheel. If the motor hits exactly the right rhythm, the wheel swings especially strongly: resonance.
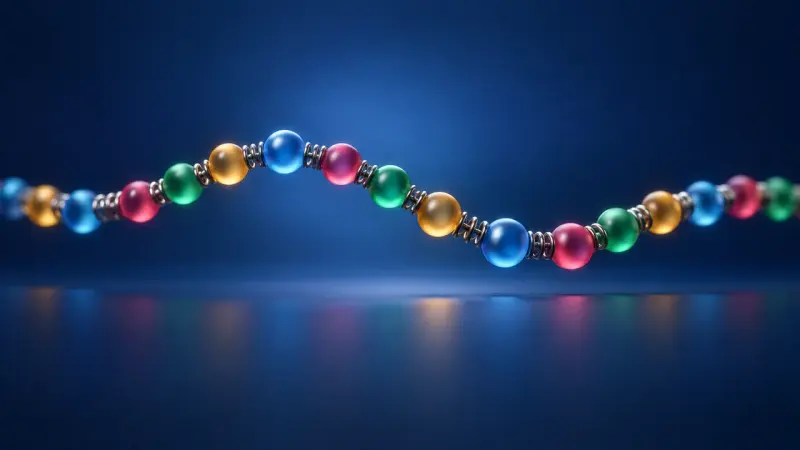
A wave travels through a chain of particles. Each particle only oscillates in place, across or along the direction of travel.
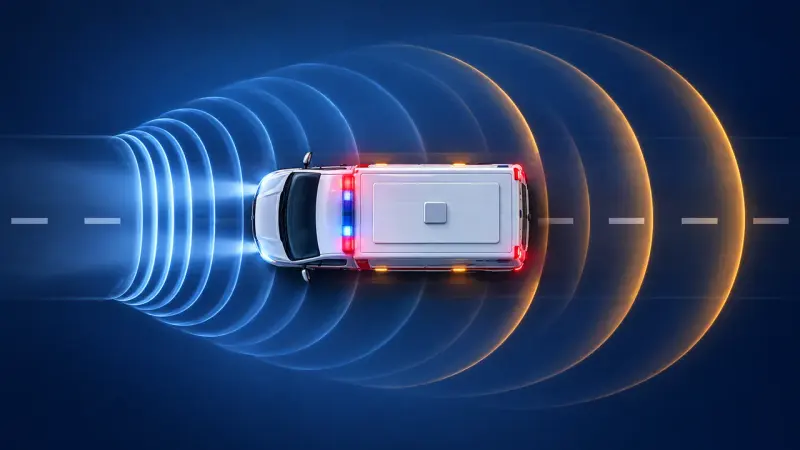
An ambulance drives past and the siren sounds lower. The wave fronts show why. You can also listen to it.
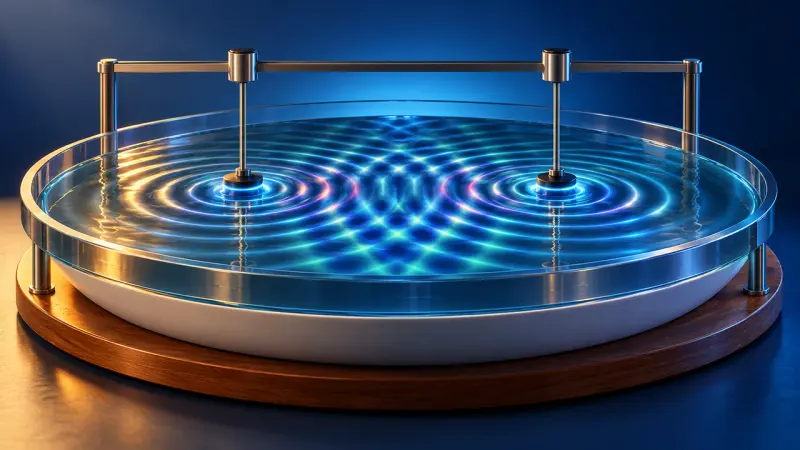
Two circular waves overlap: in some places they reinforce each other, in others they cancel out.
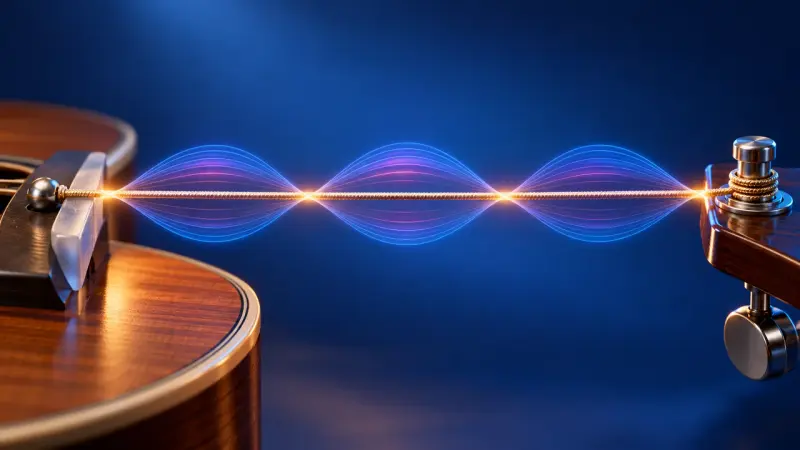
A wave is reflected at the end and a fixed pattern of nodes and antinodes appears, like on a guitar string.
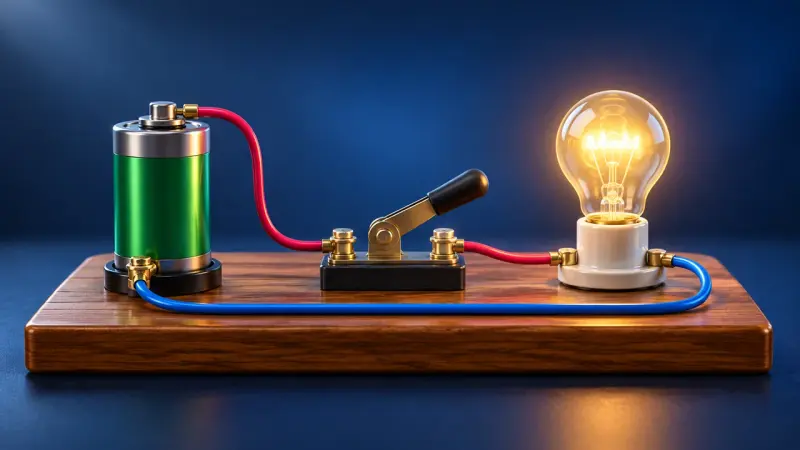
Build a circuit with a battery, a switch and a lamp, as a set-up and as a circuit diagram. When the circuit is closed, the lamp lights up.

Connect lamps in series or in parallel and measure current and voltage at different points.
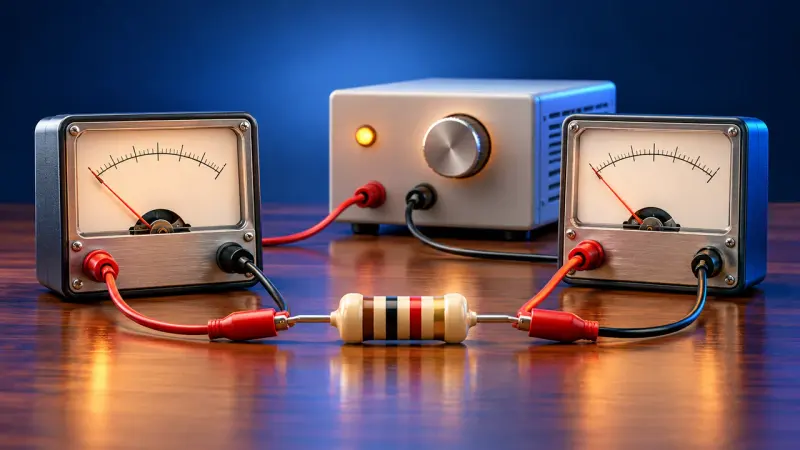
Turn up the voltage and the current rises, always in the same ratio. Point by point the characteristic curve appears, though not quite straight for a lamp.
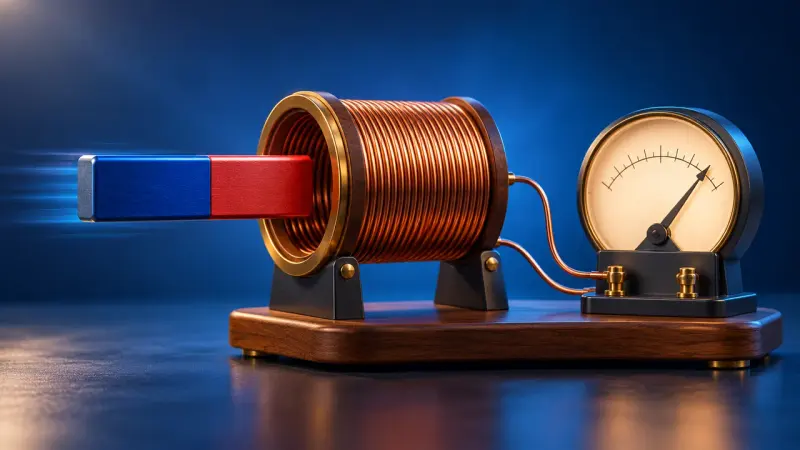
Magnet in, the needle swings. Magnet out, it swings the other way. Every generator works on the same principle.
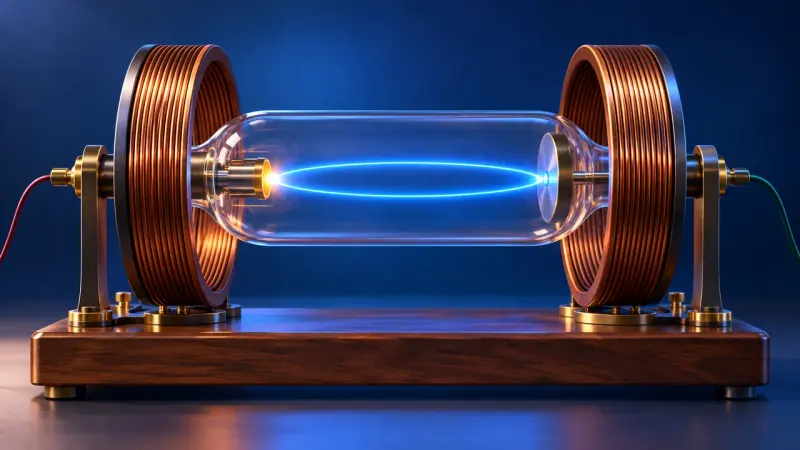
Electrons fly along a glowing circular path in a magnetic field. From the radius you determine a property of the electron.

Two charges and the field rearranges itself. A test charge measures where the force is strongest.

A capacitor charges through a resistor and discharges again. The graphs show how voltage and current change over time.
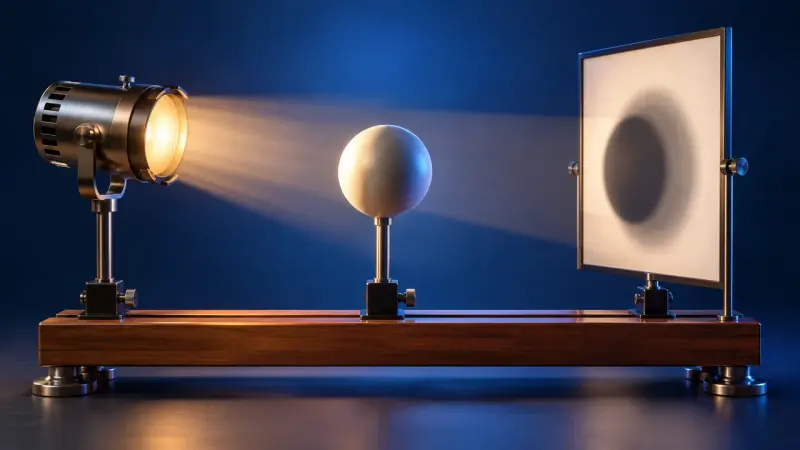
One lamp casts a sharp shadow, two lamps a penumbra. Solar and lunar eclipses form in just the same way.
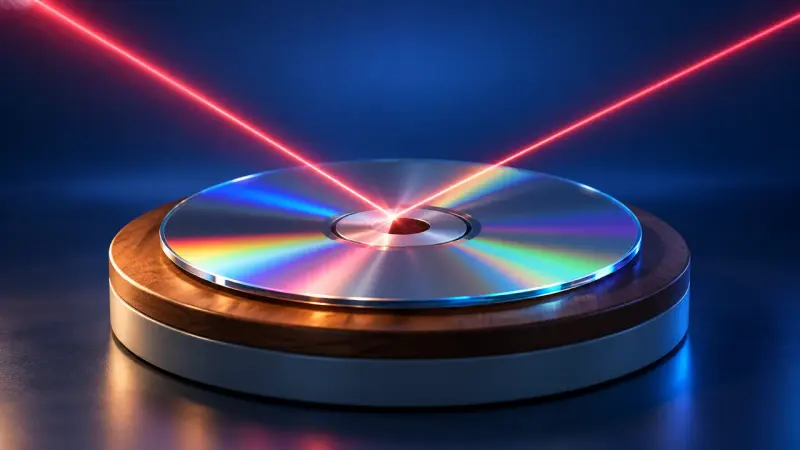
Laser at the mirror, measure the angles: angle of incidence equals angle of reflection, every time. And why does the candle appear just as far behind the mirror?

A light ray bends when it passes into glass or water. At a shallow angle it cannot get out at all: total internal reflection, as in an optical fibre.
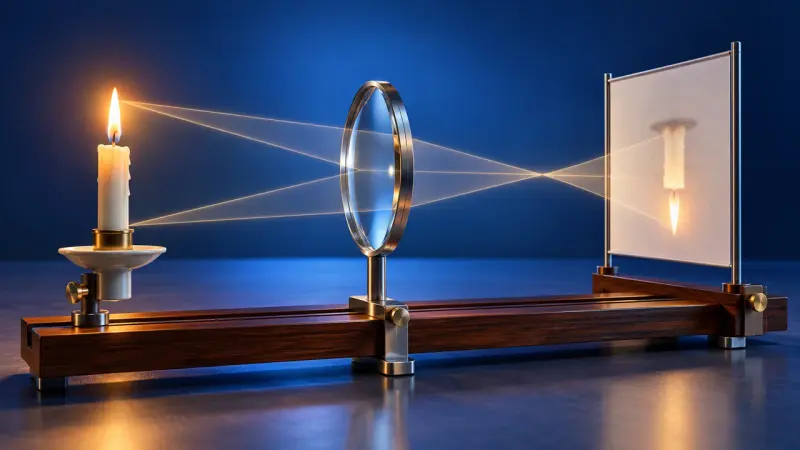
Move a candle in front of a lens and construct the image with three special rays. It becomes sharp on the screen.
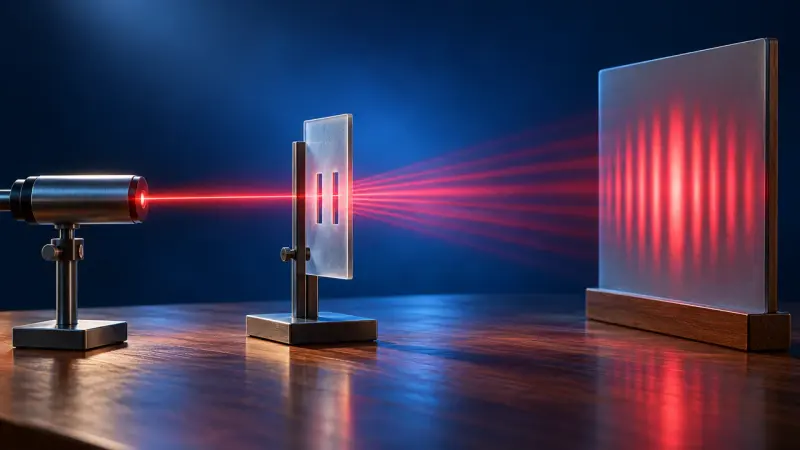
Laser light passes through a double slit or a grating. A pattern of bright and dark stripes appears on the screen.

Ice melts, water boils, and the temperature stops rising meanwhile. The particles show where the energy goes in between.
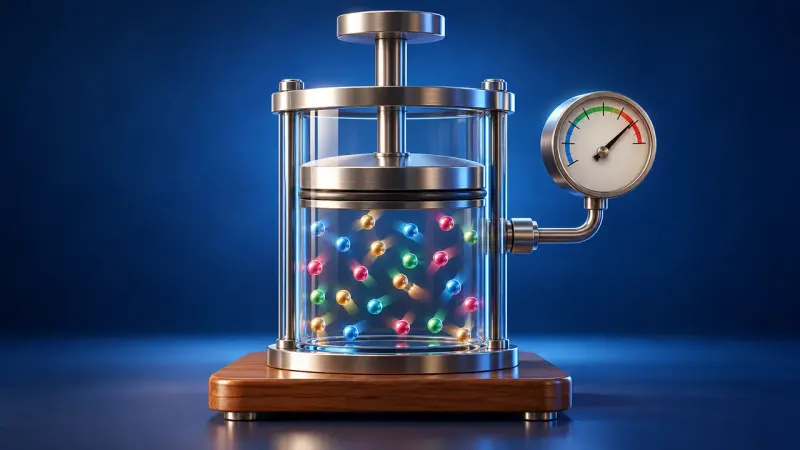
Push the piston halfway in and the pressure doubles. Heat the gas and it pushes the piston out. Pressure, volume and temperature are tightly linked.
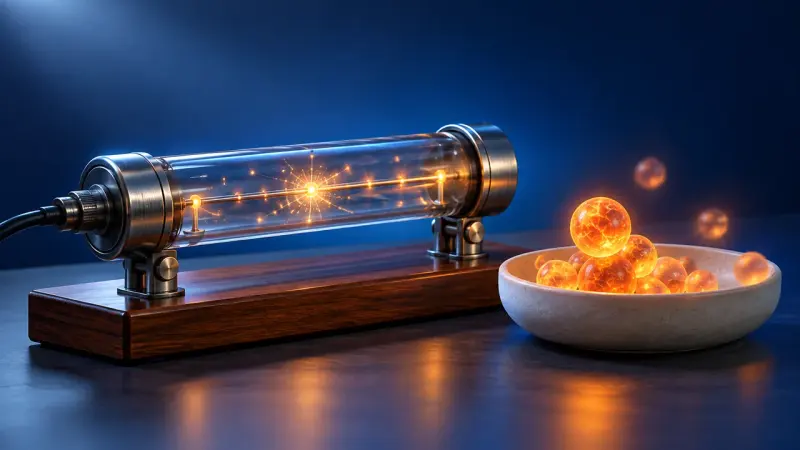
Many nuclei decay at random and a Geiger counter clicks. Even so, after each half-life almost exactly half are left.
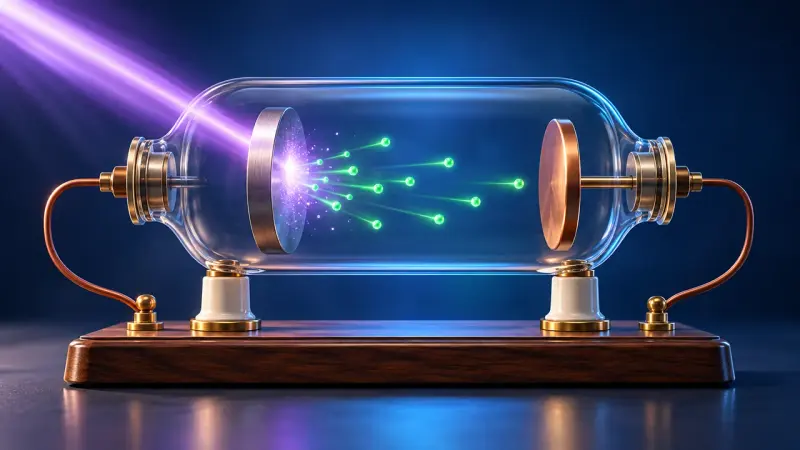
Red light can be as bright as you like, it frees not a single electron. Short-wave light does it at once. A puzzle for waves, not for photons.

Every element glows in its own colours. When an electron drops one level, exactly one line appears in the spectrum.
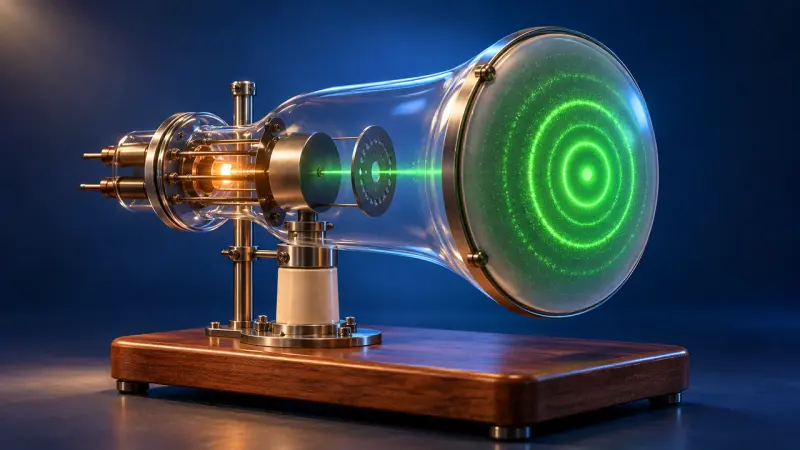
Electrons hit a thin layer of graphite and form rings on the screen, just like waves do.
Try another search term or choose a different grade level.