

Adding and subtracting integers on the number line
A frog hops past zero into the negatives. Thermometers and bank balances show why minus 3 plus 5 makes exactly 2.
MathematicsLower Saxony curriculum · Gymnasium
Double grade 7/8: the core curriculum describes learning areas for grades 7 and 8 together, so they are the same for both grades. Each school decides order and scope. The grades are therefore shown as one stage. The sub-areas are the items of the “core” (and, where present, the optional extensions); the numbers are our own and run through all double grades.
Negative numbers on the number line, adding and subtracting with the temperature model, multiplying and dividing with sign rules.
Representing and ordering numbers.
A frog hops past zero into the negatives. Thermometers and bank balances show why minus 3 plus 5 makes exactly 2.
In real contexts such as temperatures, and with patterns in sequences of calculations.
A frog hops past zero into the negatives. Thermometers and bank balances show why minus 3 plus 5 makes exactly 2.
Debt model, permanence principle and sign rules.
No separate simulation is planned for this.
Signs and operation symbols, calculating cleverly.

An expression drawn as a tree: whatever hangs lowest is calculated first. The order of operations stops being a rule and becomes visible.
Series of trials with partly symmetric, asymmetric and fully symmetric objects, probability as a prediction of relative frequency, Laplace probability, the law of large numbers, the addition and complement rules.
Cuboids or drawing pins: probability as a prediction, the law of large numbers qualitatively.

Toss a coin, a die or a drawing pin a thousand times: the more often you throw, the closer the relative frequency gets to the probability.
Distinguishing Laplace probability from relative frequency.
Toss a coin, a die or a drawing pin a thousand times: the more often you throw, the closer the relative frequency gets to the probability.
Justifying and applying the rules.
No separate simulation is planned for this.
Relationships in words, tables and graphs, proportional and inversely proportional relationships with the rule of three, and percentages and interest.
Words, tables and graphs and switching between them.

Exactly one y for every x? The arrow diagram, table and graph tell you straight away whether a relation is a function.
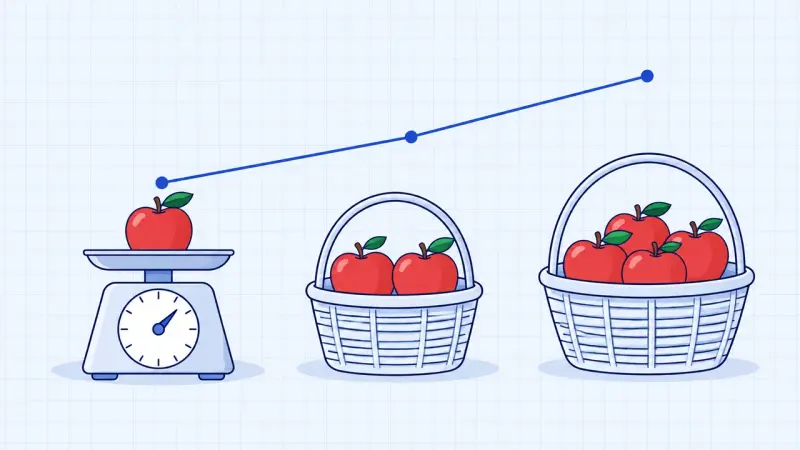
Twice as many apples cost twice as much. Picture, table and graph show together when a relation is proportional, with the rule of three.
Recognising them, the rule of three, the quotient as an amount per unit.
Twice as many apples cost twice as much. Picture, table and graph show together when a relation is proportional, with the rule of three.
Recognising them, the rule of three, the product as a total.

The hyperbola gets ever closer to its asymptotes and yet never touches them. Shifting and stretching show what the parameters do.
Using the rule of three.

Discounts, VAT, surveys: one single bar holds the base value, the percentage and the part, one above the other.
Perimeter and area of triangles, parallelograms and trapezia, surface area and volume of prisms, oblique drawings and nets.
Justifying and using formulas for perimeter and area.

Cut off a triangle and put it on the other side: the parallelogram becomes a rectangle. Triangles and trapeziums work the same way.
Comparing, estimating, calculating and justifying formulas.

Layer by layer a prism grows upwards, and the curved surface of a cylinder unrolls into a rectangle.

Fold nets of a cube, cuboid, prism, pyramid and cylinder into a solid in 3D and calculate the surface area.
Comparing and switching between representations.
Fold nets of a cube, cuboid, prism, pyramid and cylinder into a solid in 3D and calculate the surface area.
Collecting like terms, expanding and factorising, binomial formulas, and solving simple linear and proportion equations.
Collecting like terms, expanding and factorising.
An expression drawn as a tree: whatever hangs lowest is calculated first. The order of operations stops being a rule and becomes visible.
Expanding brackets, binomial formulas as a special case.

The three binomial formulas as areas: a square splits into smaller squares and rectangles.
Transforming by hand.
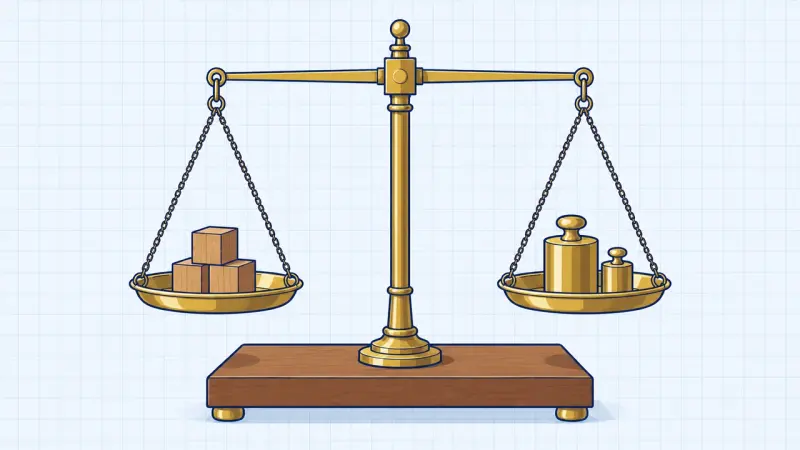
Solve linear equations on a balance: whatever you do to both sides keeps the scale balanced.
Constructing triangles with the four basic constructions, congruence, Thales’ theorem, and perpendicular bisectors, angle bisectors, medians and altitudes as loci.
Four basic constructions and congruence.

Construct triangles from three given parts with ruler and compass, step by step as in your exercise book. Sometimes there are no, one or two solutions.
Justifying and applying it.

Drag a point along the semicircle: the angle there is always a right angle.
Constructing perpendicular bisectors, angle bisectors, medians and altitudes and justifying their intersections; optionally circumcircle and incircle.
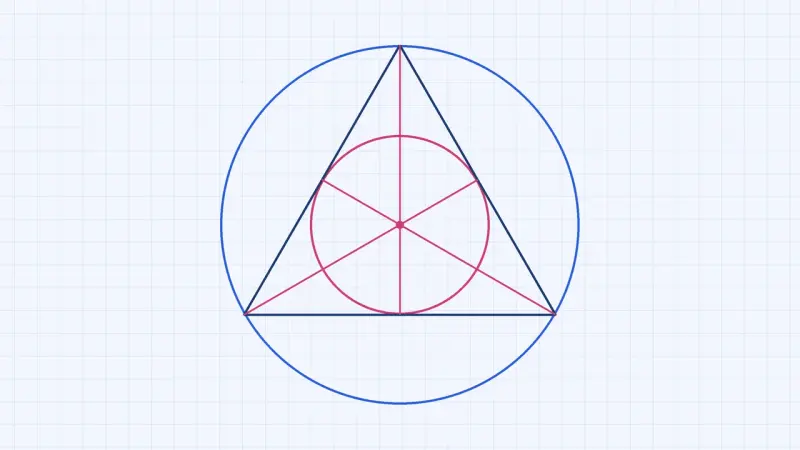
Construct the special lines in a triangle. Each set of three always meets in one point, for example at the centre of the circumcircle or the incircle.

A point equally far from A and B never lies there by chance: the perpendicular bisector appears before you draw it with compasses.
Predicting, carrying out and simulating frequencies, experiencing variability, justifying and using tree diagrams and path rules with absolute frequencies.
Predicting absolute frequencies and comparing them with series of trials; the law of large numbers.
Toss a coin, a die or a drawing pin a thousand times: the more often you throw, the closer the relative frequency gets to the probability.
Tree diagrams, drawing with and without replacement, justifying and using path rules.

How many outfits or ice cream combinations are there? A tree diagram grows step by step and shows why you multiply the options.

Draw balls from an urn, with or without replacement. The tree diagram and the path rules show how to calculate probabilities.

How likely is it that two people in a class share a birthday? From just 23 people on, it is more likely than not.
Linear functions in all representations, slope as a constant rate of change, lines of best fit, and solving linear equations and systems with two variables.
Text, diagram, table, coordinate system and equation.

Change the slope and the y-intercept of a line and read off the slope triangle and the zero.
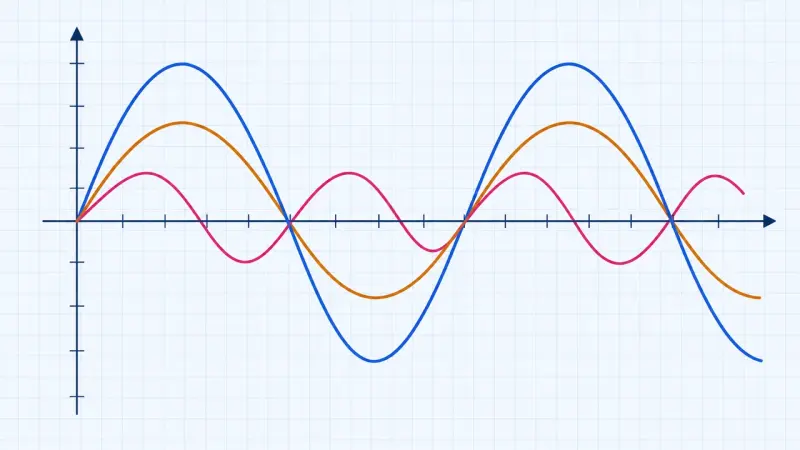
Up to three of your own functions at once, with a table of values, zeros and intersections. The tool for anything that can be a graph.
Slope triangle, y-intercept, zero, varying parameters and lines through two points.
Change the slope and the y-intercept of a line and read off the slope triangle and the zero.
Trial, working backwards, by hand and with digital tools.
Solve linear equations on a balance: whatever you do to both sides keeps the scale balanced.
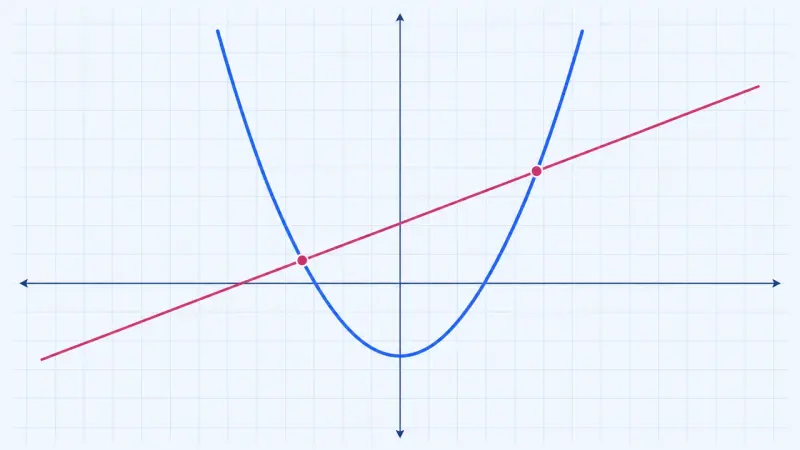
Draw both sides of an equation as graphs. The solutions are where the graphs cross.
Graphically, by substitution and equating; solvability from the graph.

Two equations are two lines. Their point of intersection is the solution, which you can read off and check.
The summaries describe the curriculum in our own words. The original text is authoritative. Original text (German): Kerncurriculum, Gymnasium, Mathematics, grade 7/8