

Power functions y = a · xⁿ
Even or odd, positive or negative: y = a · xⁿ changes with every exponent, and only a few points always stay the same.
Introductory phase of upper secondary (G9: grade 11). According to the core curriculum, the order and scope of the three learning areas are a suggestion; the sub-areas are the items of the “core”. The codes are our own.
Collecting and grouping data, bar charts and measures such as mean, median, mode, range, variance and standard deviation.
Characteristics, grouping, representativeness and bar charts.
No separate simulation is planned for this.
Interpreting measures of centre and spread and comparing data sets; optionally box plots.
No separate simulation is planned for this.
Power and root functions, comparing parameter variation for power, exponential and sine functions, and polynomial functions with zeros, symmetry and end behaviour.
Sketching graphs, end behaviour and symmetry, root functions.
Even or odd, positive or negative: y = a · xⁿ changes with every exponent, and only a few points always stay the same.
Parameter variation a · f(b · (x − c)) + d for different classes of functions.

Shift, stretch, reflect: every move of the graph leaves its mark in the function's equation.

Change the amplitude, period and shift of a sine curve with sliders or by dragging.
Seen as sums of power functions, modelling, zeros and factorised form, end behaviour and symmetry.
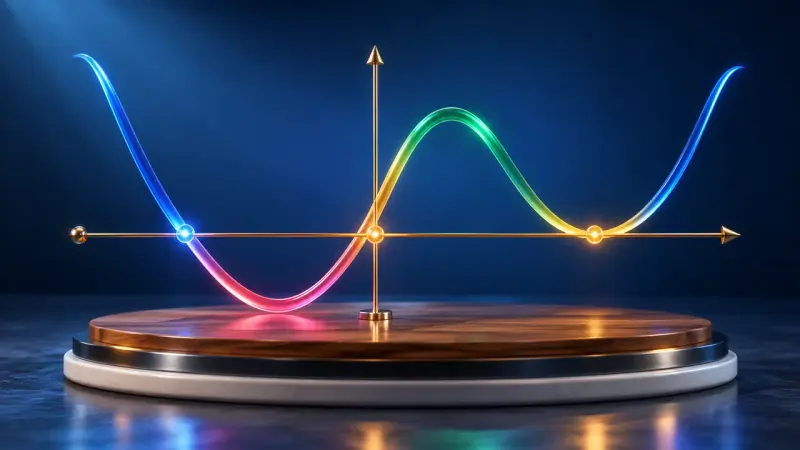
Does the graph cross the x-axis or only touch it? The multiplicity of the zero decides, the highest power decides what happens far out.

What happens to a graph when x gets very large? A point runs outwards and a magnifier shows how close it gets to the asymptote.

Up to three of your own functions at once, with a table of values, zeros and intersections. The tool for anything that can be a graph.
The root function and the reciprocal function as inverse functions.

Reflect the graph in y = x and the inverse function appears. It only works if no function value occurs twice.
From average to instantaneous rate of change, the derivative function graphically and with rules, tangents, monotonicity, extrema and points of inflection, and optimisation problems.
Difference quotient, slope of secant and tangent, limit notation.

Let a point Q move towards P: the secant becomes the tangent, and the average slope becomes the derivative.
Developing graph and derivative graph from each other, sum and constant-multiple rules, derivatives of power, sine and cosine functions.

A tangent slides along the graph and draws its slope as a new graph: the derivative function.
Tangents and normals, monotonicity, extrema and points of inflection, optimisation problems.

Analyse a graph step by step: zeros, maximum and minimum points, inflection points and where it rises or falls.

Which box holds the most, which can uses the least metal? Five everyday problems show how to find the best solution with the derivative.
The summaries describe the curriculum in our own words. The original text is authoritative. Original text (German): Kerncurriculum, Gymnasium, Mathematics, grade 11