

Two-way tables and Venn diagrams
A two-way table, a Venn diagram and a tree diagram show the same data and are linked. Change one and the others follow.
Double grade 9/10: the core curriculum describes learning areas for grades 9 and 10 together, so they are the same for both grades. Each school decides order and scope. The grades are therefore shown as one stage. The sub-areas are the items of the “core” (and, where present, the optional extensions); the numbers are our own and run through all double grades.
Representing data with two characteristics and two-stage random experiments in tree diagrams and two-way tables and finding unknown probabilities, preparing conditional probability.
Completing entries and switching between representations.
A two-way table, a Venn diagram and a tree diagram show the same data and are linked. Change one and the others follow.
Representing and analysing them in tree diagrams and two-way tables.

Draw balls from an urn, with or without replacement. The tree diagram and the path rules show how to calculate probabilities.
A two-way table, a Venn diagram and a tree diagram show the same data and are linked. Change one and the others follow.
Finding and interpreting them using absolute frequencies.

A medical test is positive, but how likely is it that you are really ill? 1000 people show why the answer is often surprising.
Similar triangles, Pythagoras’ theorem and related theorems, roots as the inverse of squaring, sine, cosine and tangent, and the laws of sines and cosines.
Recognising similar triangles, similarity theorems, calculating lengths.
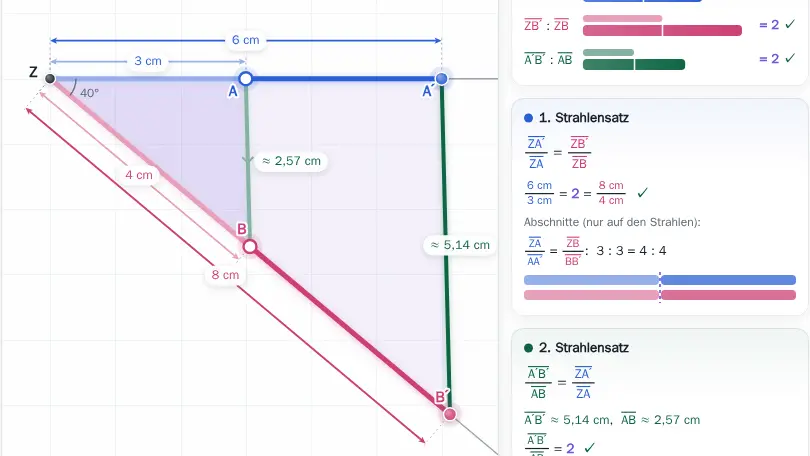
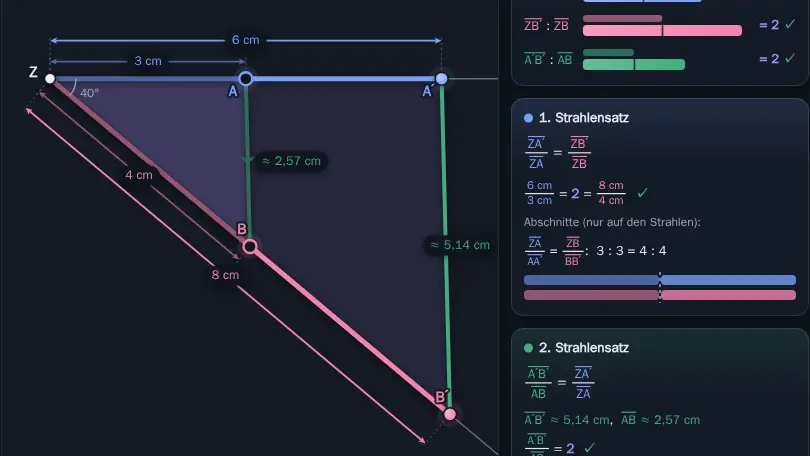
How tall is the tree without climbing it? Two rays and a parallel line are enough, because the ratios stay the same.

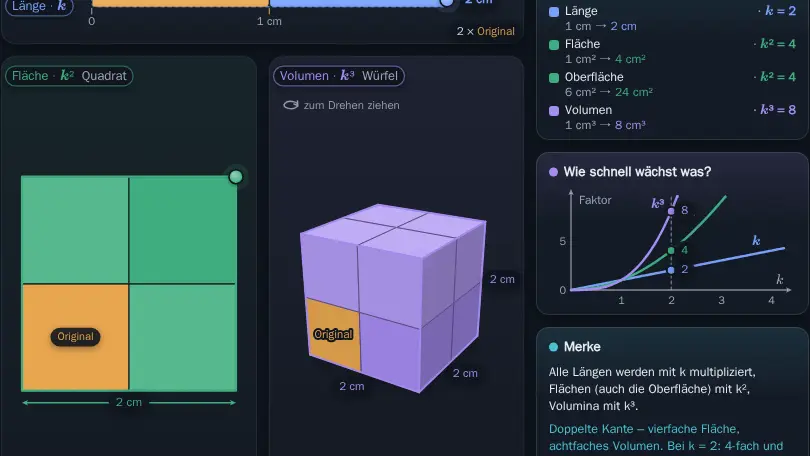
Enlarge lengths, areas and solids. Doubling the length makes the area four times and the volume eight times as large.
Justifying and applying them.
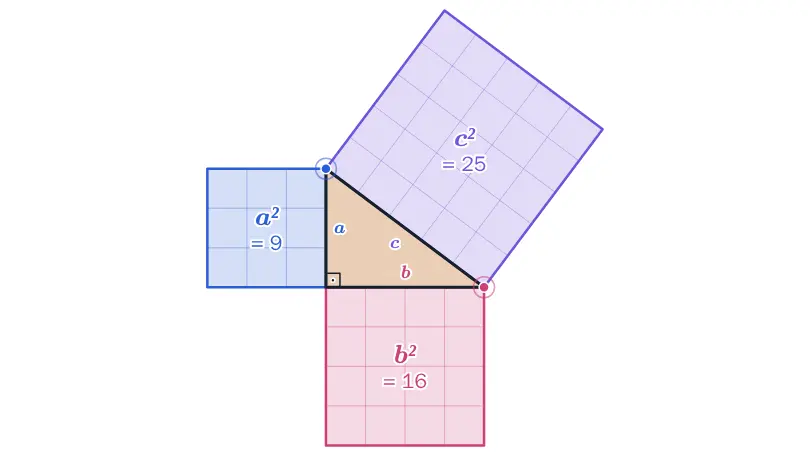

Squares on the sides of a right triangle and a puzzle proof show: a² + b² = c².
Taking roots as an inverse operation, laws, calculating lengths.

Step by step, a rectangle turns into a square with the same area. The method is almost 2000 years old and reaches √2 surprisingly quickly.
Sine, cosine and tangent in right triangles, tangent as a measure of slope.

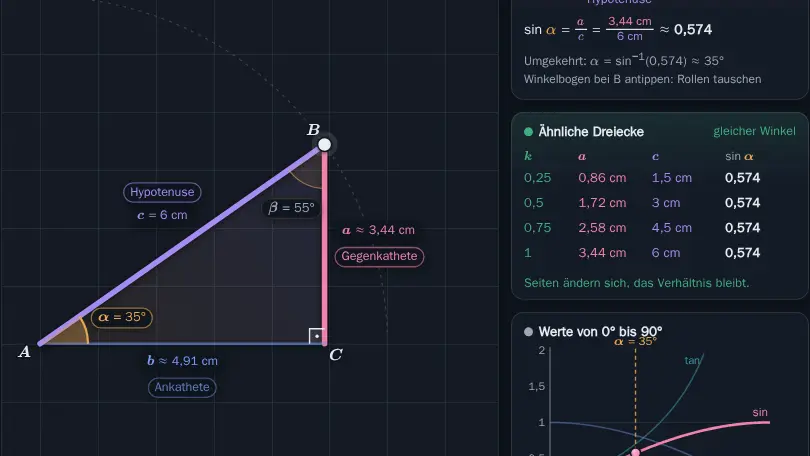
In a right triangle, the ratio of two sides depends only on the angle. This gives sine, cosine and tangent, with examples such as ramps and ladders.
Law of sines and law of cosines.

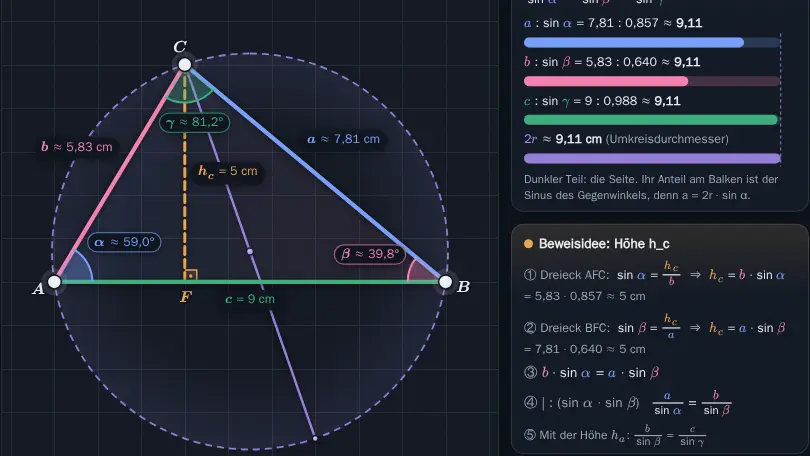
Calculate sides and angles in any triangle with the law of sines and the law of cosines. A helper shows which law fits your problem.
Quadratic functions in general, factorised and vertex form, solving quadratic equations, optimisation and parabolas of best fit, and the parabola as a locus.
Varying parameters and switching between the three forms.

Stretch, reflect and shift parabolas and read off the vertex and the zeros.

Up to three of your own functions at once, with a table of values, zeros and intersections. The tool for anything that can be a graph.
Linking solutions to the graph and the structure of the term, the quadratic formula.
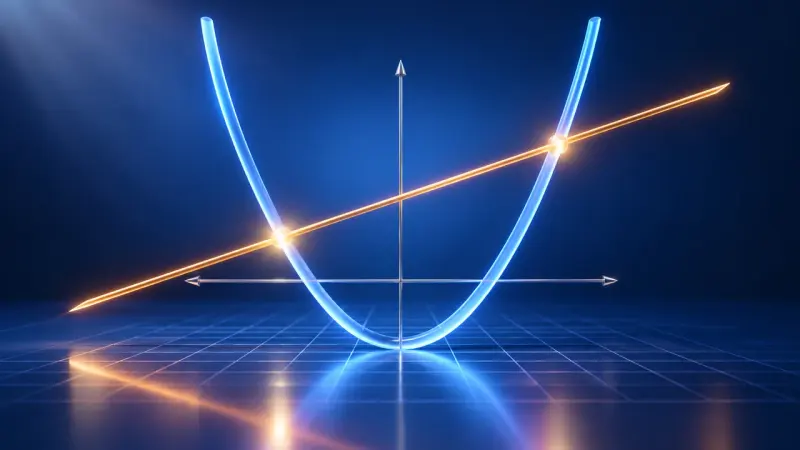
Draw both sides of an equation as graphs. The solutions are where the graphs cross.
Optimisation problems, finding zeros and parabolas of best fit.

Which enclosure has the largest area? Picture and graph show the maximum, first by trying, then by exact calculation.

Drag three points and the matching parabola always passes through all of them. The equation is worked out step by step.
Equal distance from a point and a line.
No separate simulation is planned for this.
The number π by approximation, circumference, area, arcs and sectors, and surface area and volume of cylinders, pyramids, cones and spheres.
The path to π, arc length, sectors and radians.

A wheel rolls once and travels a bit more than three times its diameter. Cut into pieces, the circle becomes a rectangle and the area formula follows.
Surface area and volume of cylinders, pyramids, cones and spheres.
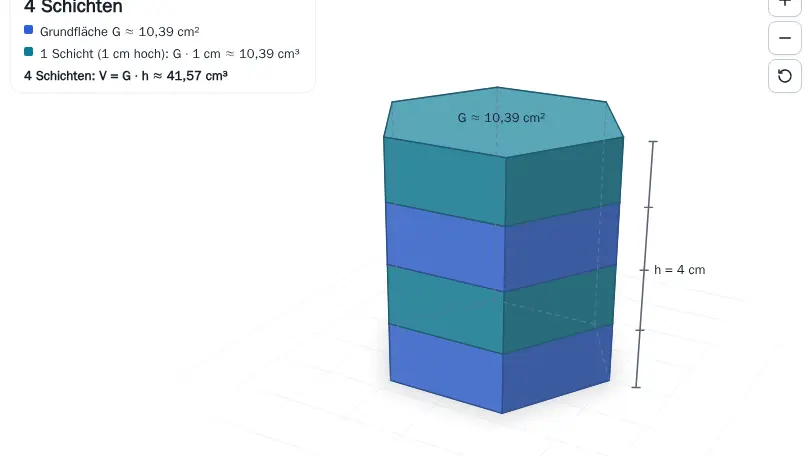
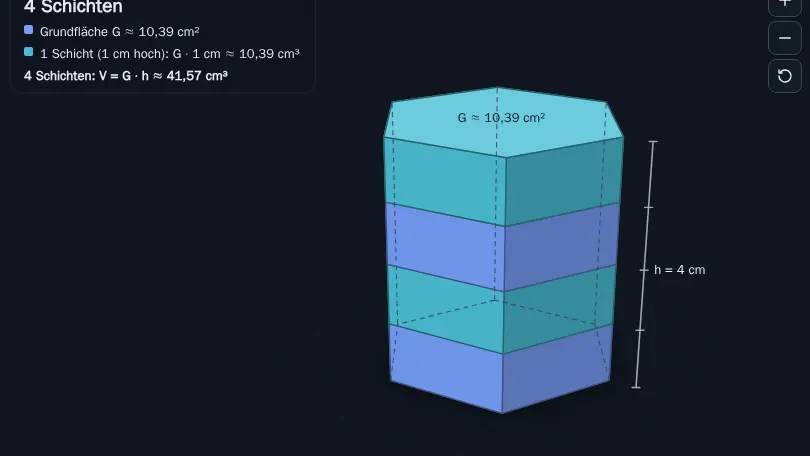
Layer by layer a prism grows upwards, and the curved surface of a cylinder unrolls into a rectangle.

Pour three times and the prism is full: a pyramid holds exactly one third. Cones and spheres can be turned and measured in 3D.
Deriving the volume of pyramids, cones and spheres and the surface area of cones and spheres.

Push a stack of coins sideways: the shape changes, but the volume stays the same. This is Cavalieri's principle.
Exponential growth and decay iteratively and explicitly, limited growth, exponential functions with parameters, laws of exponents, taking roots and logarithms.
Distinguishing linear and exponential, combinations and the limit of limited growth.

Water lilies on a pond, compound interest and decay: exponential growth compared with linear growth.
Varying parameters, sketching graphs, the equation from two points.
Water lilies on a pond, compound interest and decay: exponential growth compared with linear growth.
Justifying laws of exponents, solving equations also by taking logarithms.
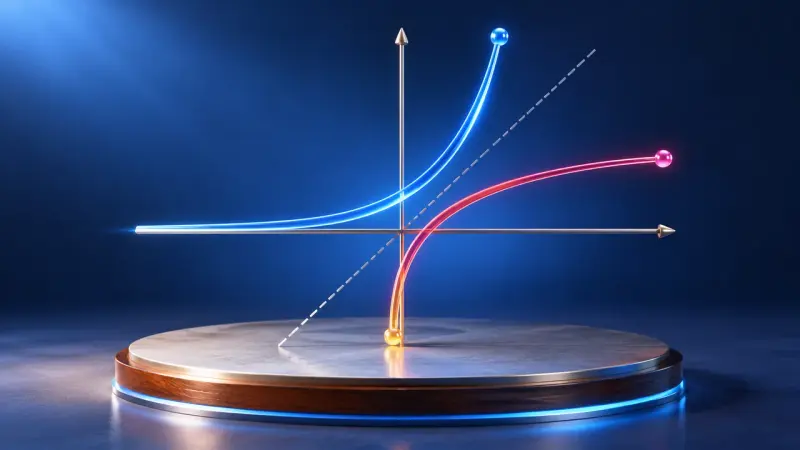
The logarithm answers the question: to what power do I raise the base to get this number? With graphs, rules and exponential equations.
Sine and cosine on the unit circle, degrees and radians, parameters of the general sine function and modelling periodic processes.
Definition on the unit circle, degrees and radians.

Sine, cosine and tangent on the unit circle, and how the sine curve grows out of it.
Parameters of f(x) = a · sin(b · (x − c)) + d.

Change the amplitude, period and shift of a sine curve with sliders or by dragging.
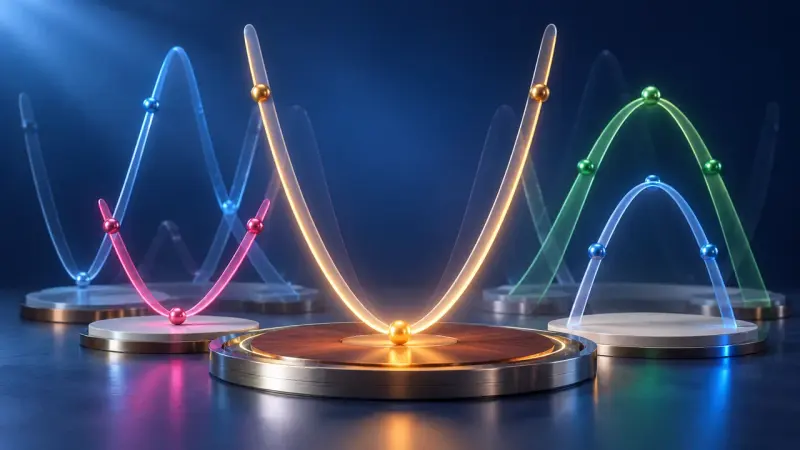
Shift, stretch, reflect: every move of the graph leaves its mark in the function's equation.
Tides, day length, temperature.
Change the amplitude, period and shift of a sine curve with sliders or by dragging.
Comparing limiting processes: approximating square roots and π, 0.9 recurring equals 1, decay and limited growth, the graph of 1/x; irrationality and the real numbers.
Approximating irrational square roots, the number π, exponential decay and the limiting behaviour of 1/x.
Step by step, a rectangle turns into a square with the same area. The method is almost 2000 years old and reaches √2 surprisingly quickly.
A wheel rolls once and travels a bit more than three times its diameter. Cut into pieces, the circle becomes a rectangle and the area formula follows.

What happens to a graph when x gets very large? A point runs outwards and a magnifier shows how close it gets to the asymptote.
A proof of irrationality and the real numbers.
Step by step, a rectangle turns into a square with the same area. The method is almost 2000 years old and reaches √2 surprisingly quickly.
The summaries describe the curriculum in our own words. The original text is authoritative. Original text (German): Kerncurriculum, Gymnasium, Mathematics, grade 9/10