
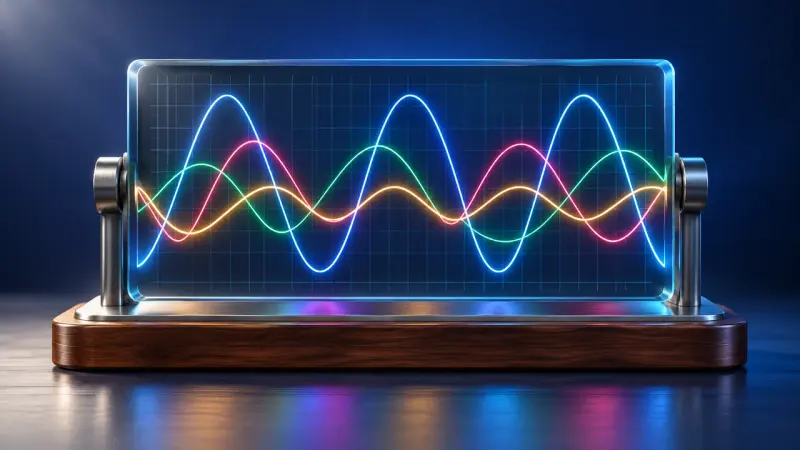
Function plotter with custom terms
Up to three of your own functions at once, with a table of values, zeros and intersections. The tool for anything that can be a graph.
Main phase, first and second half-year (here grade 12): learning areas 1 to 5 for the basic and the advanced course; LK = advanced course only. The numbers are those of the curriculum.
Polynomial and other basic functions, combining and composing functions, rules of differentiation, inverse functions; LK: families of functions.
Up to three of your own functions at once, with a table of values, zeros and intersections. The tool for anything that can be a graph.
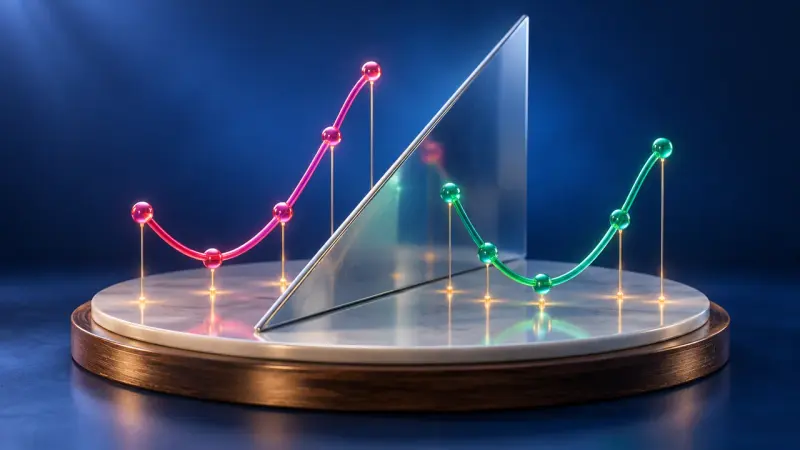
Reflect the graph in y = x and the inverse function appears. It only works if no function value occurs twice.

Analyse a graph step by step: zeros, maximum and minimum points, inflection points and where it rises or falls.

One parameter, infinitely many graphs. Where do the maxima go as k grows? Along a curve of their own, the locus.
Areas and reconstructing totals, the integral function and the fundamental theorem, rules of integration, applications including solids of revolution.

The height of one graph becomes the slope of another. If you understand bank balances, the antiderivative comes quicker than you think.

Fill the area under a graph with rectangles. The more rectangles, the more precisely you get the value of the integral.

The area under a graph grows as you move along. Its rate of change is exactly the function itself: this is the fundamental theorem.
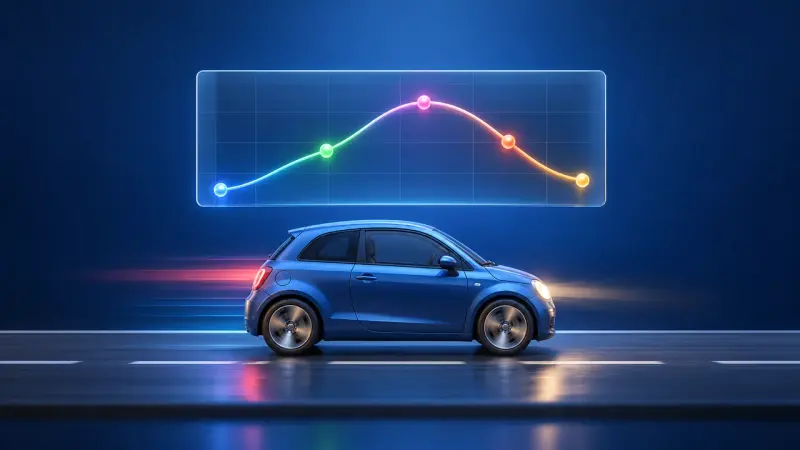
From the speed of a car you get the distance travelled: the area under the curve shows the total change.
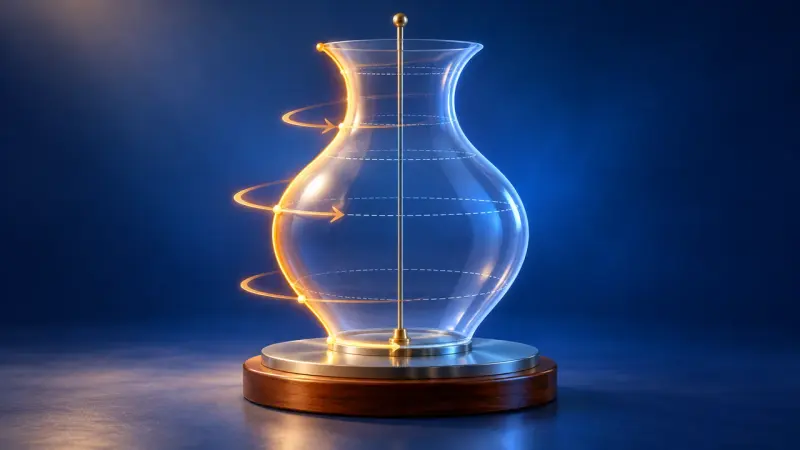
The area under a graph rotates about the x-axis and becomes a solid. Its volume is calculated with thin discs.
Deepening the basics of probability from lower secondary, Bernoulli experiments.

How likely is it that two people in a class share a birthday? From just 23 people on, it is more likely than not.

A two-way table, a Venn diagram and a tree diagram show the same data and are linked. Change one and the others follow.

A medical test is positive, but how likely is it that you are really ill? 1000 people show why the answer is often surprising.

Left or right at every pin, purely by chance. Yet every time the balls pile up into the same bell shape.

Play yourself or simulate thousands of games: is it worth switching doors?

The histogram of the binomial distribution: choose a range and read off the probability directly.
Points in space, vectors as translations, calculating with vectors, magnitude and dot product; LK: cross product.
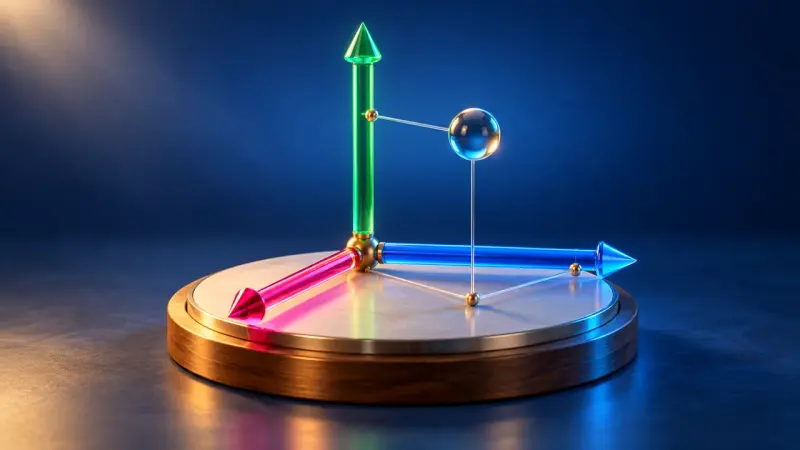
Place points in 3D coordinates, rotate the view and calculate distances with Pythagoras' theorem.

Drag vector arrows in space, add them and multiply them by numbers. The calculation is shown alongside in column form.
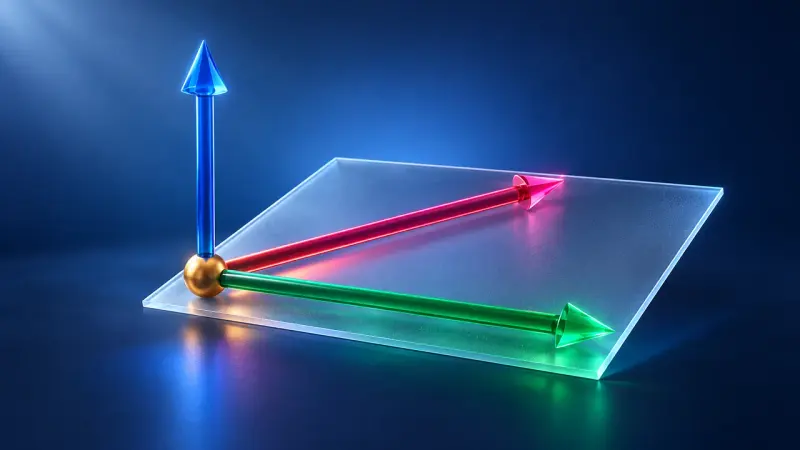
The dot product tells you the angle between two vectors; the cross product gives a perpendicular vector and an area.
Linear combinations, lines and planes, relative positions, applications; in the basic course partly in the third half-year, depending on its length.
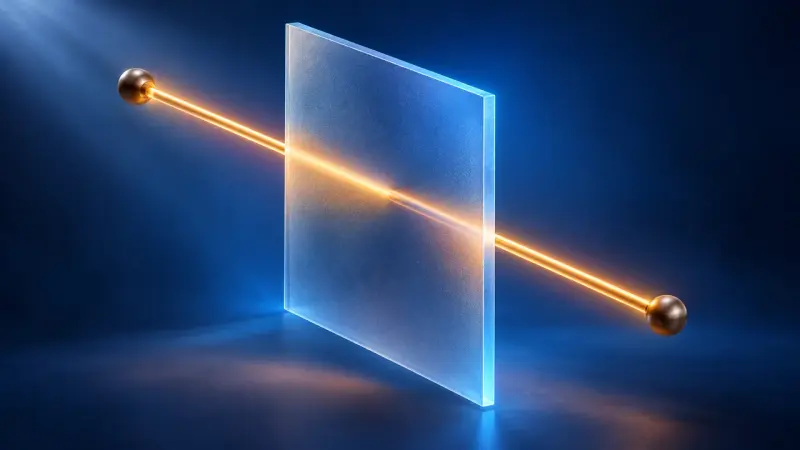
A point travels along a line through space, two vectors span a plane. Parametric, normal and coordinate forms all describe the same thing.
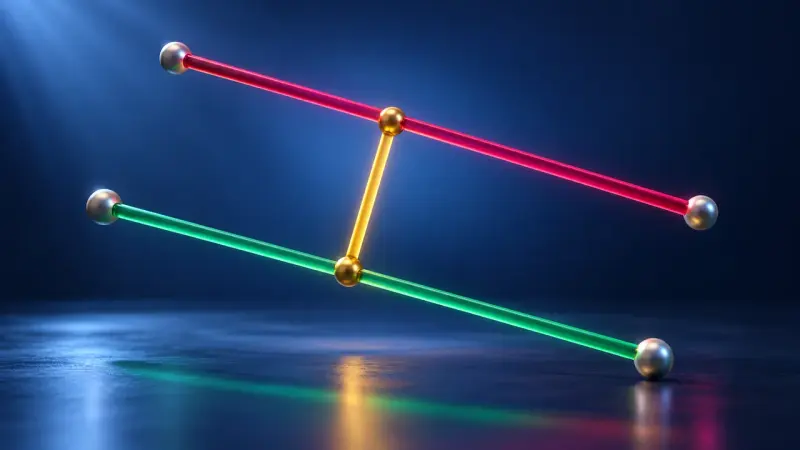
Do the lines meet, run parallel or pass each other by? In a 3D space you can turn, intersections, angles and distances become visible.
The summaries describe the curriculum in our own words. The original text is authoritative. Original text (German): Lehrplan, Gymnasium, Mathematics, grade 12