

Adding and subtracting integers on the number line
A frog hops past zero into the negatives. Thermometers and bank balances show why minus 3 plus 5 makes exactly 2.
Grade 7: the framework curriculum for grades 1–10 is organised by levels A–H, not by grades; at the Gymnasium grade 7 works at level E; E and F are linked within grades 7/8. Units are the subject areas, sub-units their topics; the numbers are our own.
Percentages as another way of writing fractions, negative and rational numbers on the number line, absolute value and opposite, recurring decimals.
A frog hops past zero into the negatives. Thermometers and bank balances show why minus 3 plus 5 makes exactly 2.

Discounts, VAT, surveys: one single bar holds the base value, the percentage and the part, one above the other.
Interpreting the four operations with rational numbers as changes of state, percentages with the percentage bar, rule of three and proportions.
A frog hops past zero into the negatives. Thermometers and bank balances show why minus 3 plus 5 makes exactly 2.
Discounts, VAT, surveys: one single bar holds the base value, the percentage and the part, one above the other.

An expression drawn as a tree: whatever hangs lowest is calculated first. The order of operations stops being a rule and becomes visible.
Converting quantities and units, including ares, hectares and km², taking measurements from sketches and scale drawings and measuring.
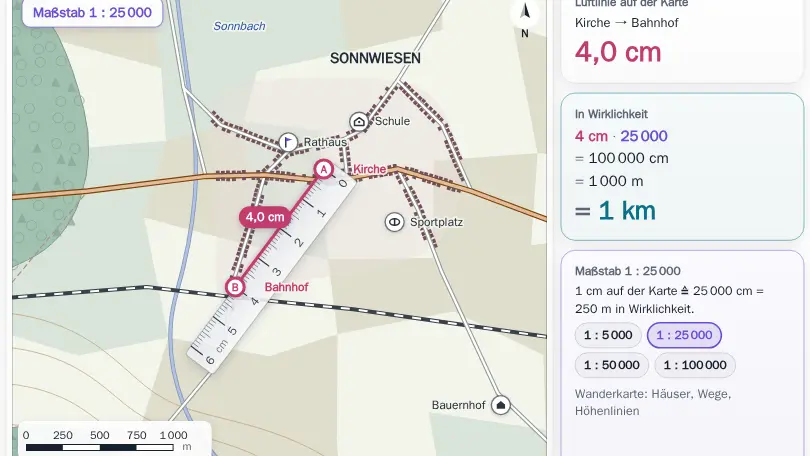

Measure on a map with a ruler and use the scale to work out the real distance.
Perimeter and area of triangles, quadrilaterals and circles by dissection and completion, volume and surface area of prisms and cylinders, Pythagoras’ theorem.
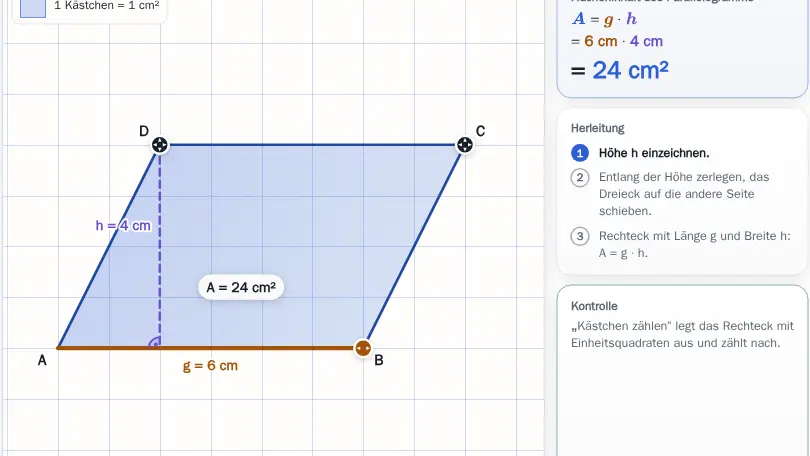
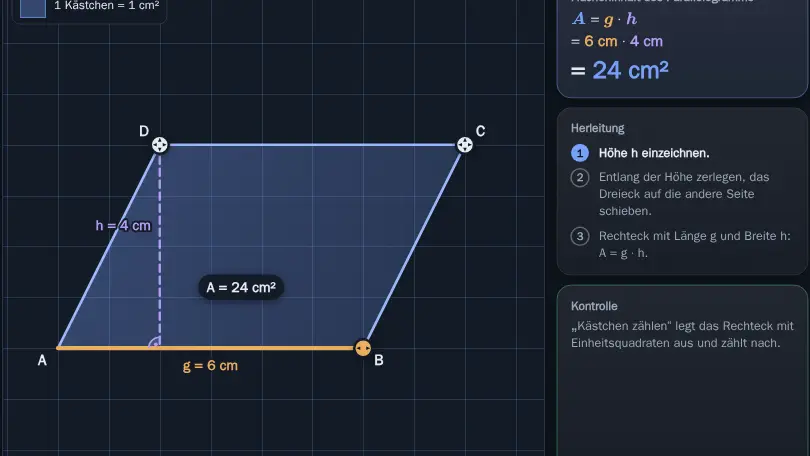
Cut off a triangle and put it on the other side: the parallelogram becomes a rectangle. Triangles and trapeziums work the same way.

A wheel rolls once and travels a bit more than three times its diameter. Cut into pieces, the circle becomes a rectangle and the area formula follows.
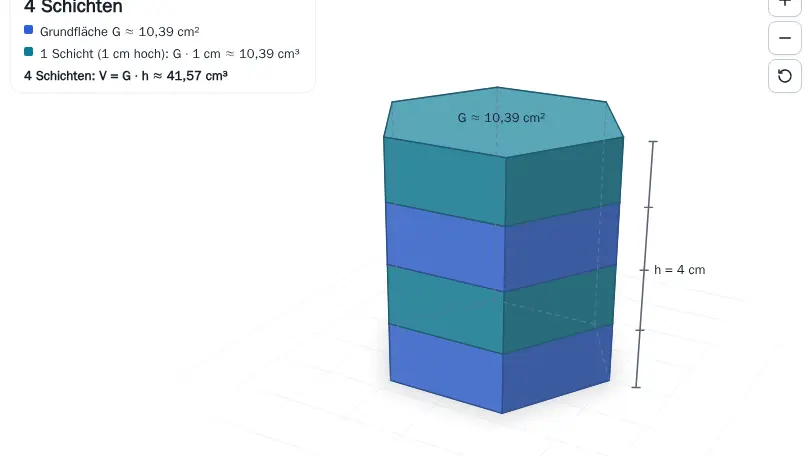
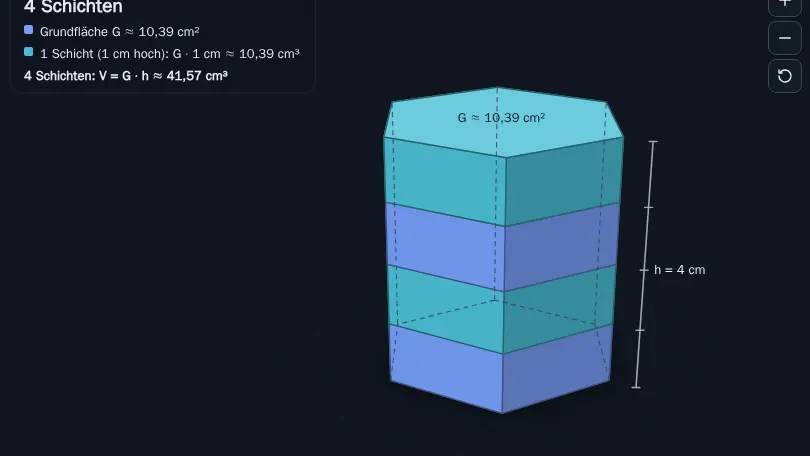
Layer by layer a prism grows upwards, and the curved surface of a cylinder unrolls into a rectangle.
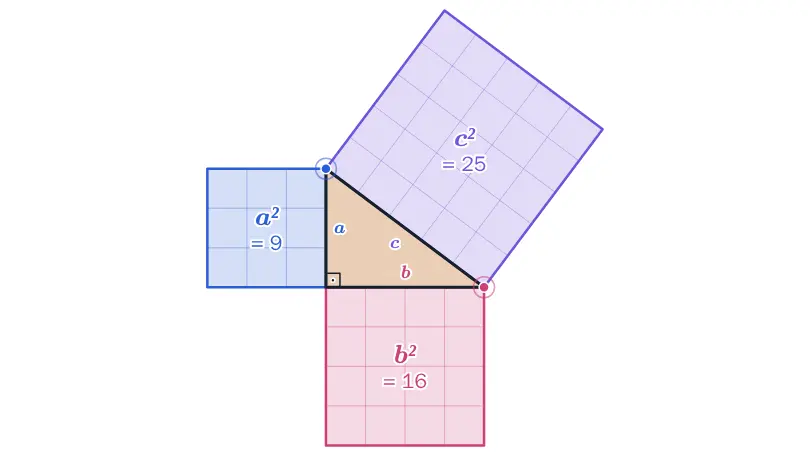

Squares on the sides of a right triangle and a puzzle proof show: a² + b² = c².
Measure on a map with a ruler and use the scale to work out the real distance.
Types of triangle and special lines, angle sum, the theorems of Thales and Pythagoras, nets and oblique drawings of prisms and cylinders, constructions using the congruence criteria.

Tear off three corners, put them side by side, and you get a straight line: 180°, for every triangle. A quadrilateral gives 360°.
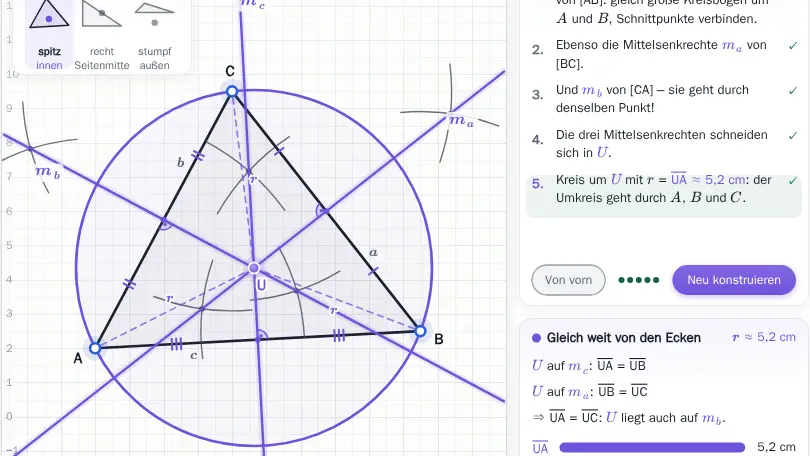

Construct the special lines in a triangle. Each set of three always meets in one point, for example at the centre of the circumcircle or the incircle.

A point equally far from A and B never lies there by chance: the perpendicular bisector appears before you draw it with compasses.

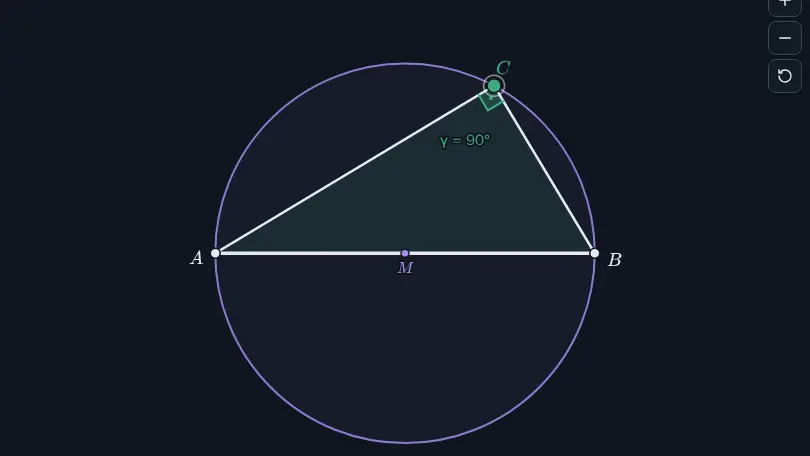
Drag a point along the semicircle: the angle there is always a right angle.
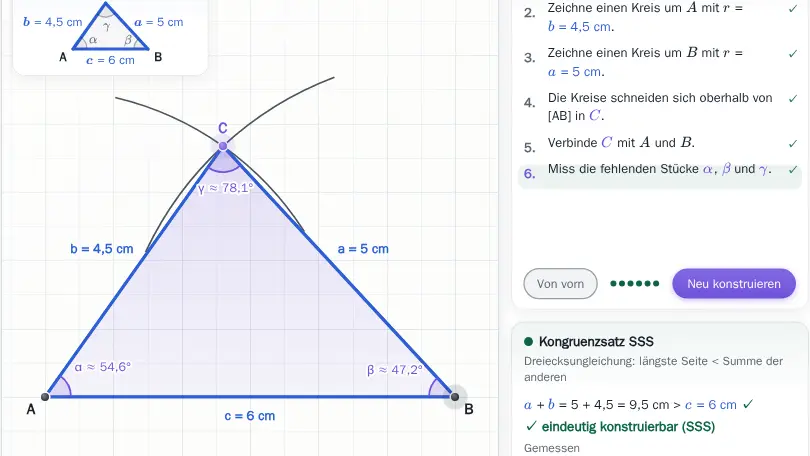
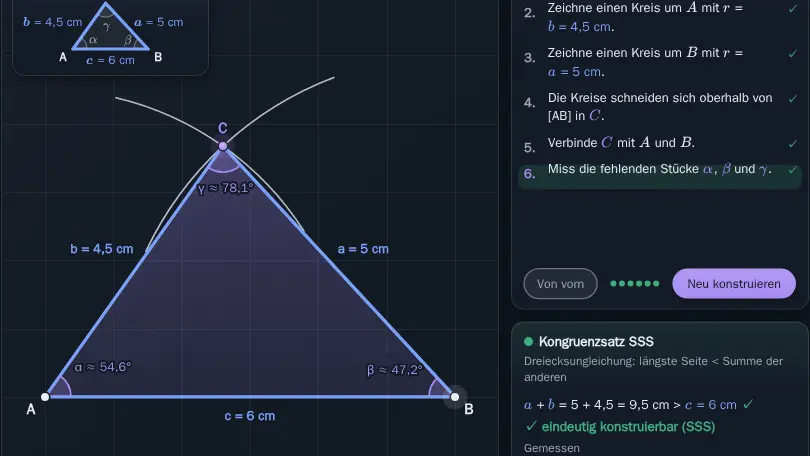
Construct triangles from three given parts with ruler and compass, step by step as in your exercise book. Sometimes there are no, one or two solutions.

Two lines cross and one of them turns. Which angles stay equal? At parallel lines they are called corresponding and alternate angles.

Move one corner and the square becomes a kite. When does a quadrilateral get which name?

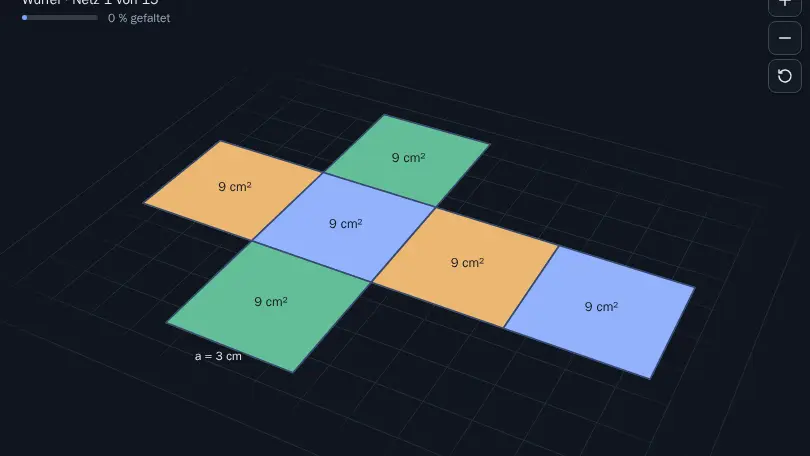
Fold nets of a cube, cuboid, prism, pyramid and cylinder into a solid in 3D and calculate the surface area.
Recognising congruent and similar figures, describing congruence and similarity transformations, enlarging and reducing to scale.

In a line or in a point: the shape flips over, and every construction step with the set square stays visible.
Setting up terms, linear equations and proportions and solving them by trial, graphically and by equivalent transformations; rearranging formulas.

Solve linear equations on a balance: whatever you do to both sides keeps the scale balanced.
An expression drawn as a tree: whatever hangs lowest is calculated first. The order of operations stops being a rule and becomes visible.
Distinguishing direct and inverse proportion and showing them in all four quadrants, also with scales and percentages.

Twice as many apples cost twice as much. Picture, table and graph show together when a relation is proportional, with the rule of three.

Exactly one y for every x? The arrow diagram, table and graph tell you straight away whether a relation is a function.
Planning surveys, showing data in pie charts too, comparing mean, mode and median.

One outlier pulls the mean away while the median barely moves. Dragging single data points shows which value is how robust.

Show the same data as bar, line and pie charts and more, and discover how charts can mislead.
Sample spaces and events, relative frequencies also of two-stage experiments, the law of large numbers and the Laplace rule.

Toss a coin, a die or a drawing pin a thousand times: the more often you throw, the closer the relative frequency gets to the probability.

How many outfits or ice cream combinations are there? A tree diagram grows step by step and shows why you multiply the options.
The summaries describe the curriculum in our own words. The original text is authoritative. Original text (German): Rahmenlehrplan, Gymnasium, Mathematics, grade 7