

Powers, powers of ten and orders of magnitude
From a grain of sand to the Earth in steps of ten. Along the way it becomes clear why 10⁶ is a million and how to write tiny numbers.
Grade 8: the framework curriculum for grades 1–10 is organised by levels A–H, not by grades; at the Gymnasium grade 8 works at level F; topics from G and H may be anticipated. Units are the subject areas, sub-units their topics; the numbers are our own.
Powers and powers of ten with natural exponents, ordering and rounding rational numbers.
From a grain of sand to the Earth in steps of ten. Along the way it becomes clear why 10⁶ is a million and how to write tiny numbers.
Powers as repeated multiplication, square and cube roots as inverses, percentages with discounts and interest.

Step by step, a rectangle turns into a square with the same area. The method is almost 2000 years old and reaches √2 surprisingly quickly.
From a grain of sand to the Earth in steps of ten. Along the way it becomes clear why 10⁶ is a million and how to write tiny numbers.
Unit prefixes from milli to kilo with powers of ten, quantities in work-related contexts.
Matching simulations are listed under Grade 5/6, Grade 7, Grade 10
Area of composite figures, volume and surface area of solids including square pyramids, composite solids.
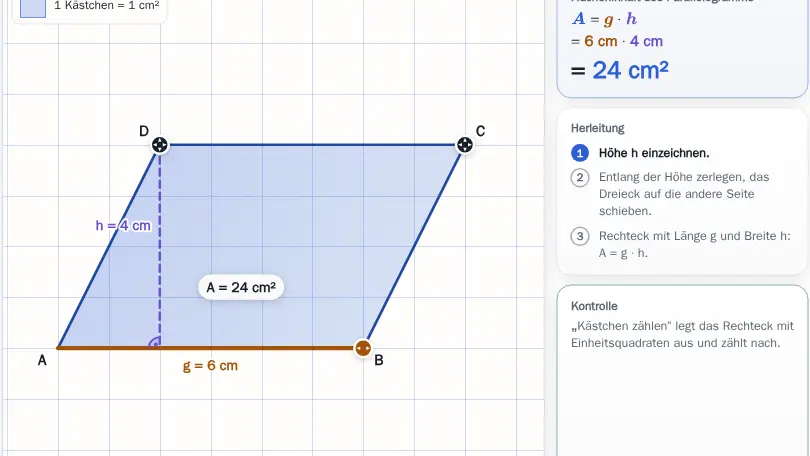
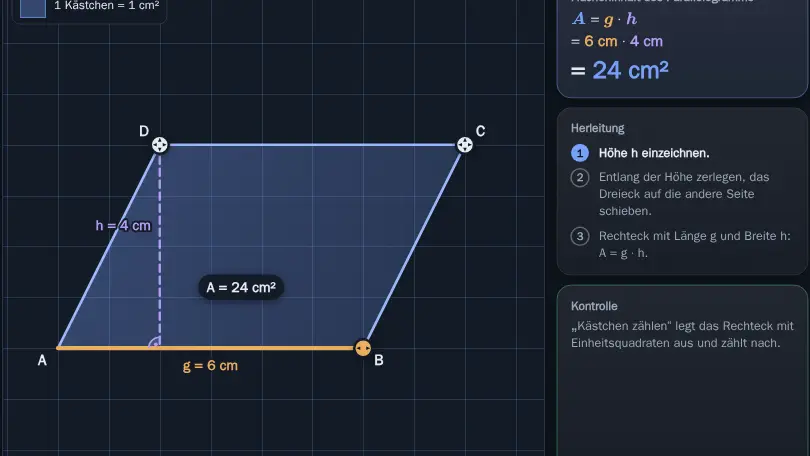
Cut off a triangle and put it on the other side: the parallelogram becomes a rectangle. Triangles and trapeziums work the same way.
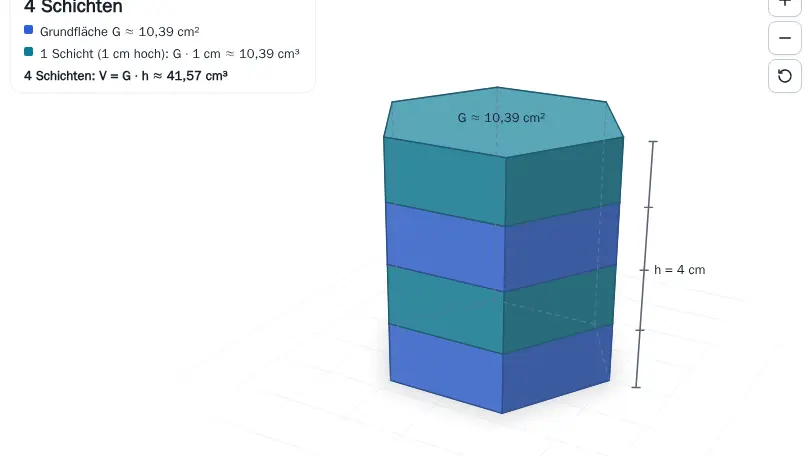
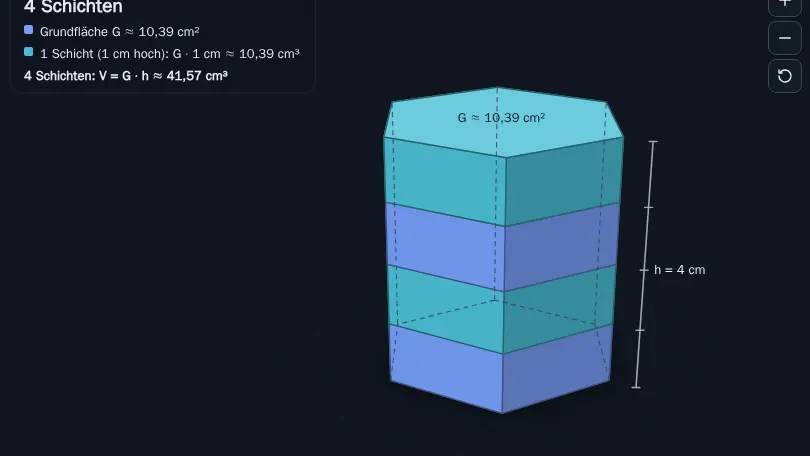
Layer by layer a prism grows upwards, and the curved surface of a cylinder unrolls into a rectangle.

Pour three times and the prism is full: a pyramid holds exactly one third. Cones and spheres can be turned and measured in 3D.

A wheel rolls once and travels a bit more than three times its diameter. Cut into pieces, the circle becomes a rectangle and the area formula follows.
Describing parts of solids and figures, using position and size relations for calculations, nets and oblique drawings also of pyramids.

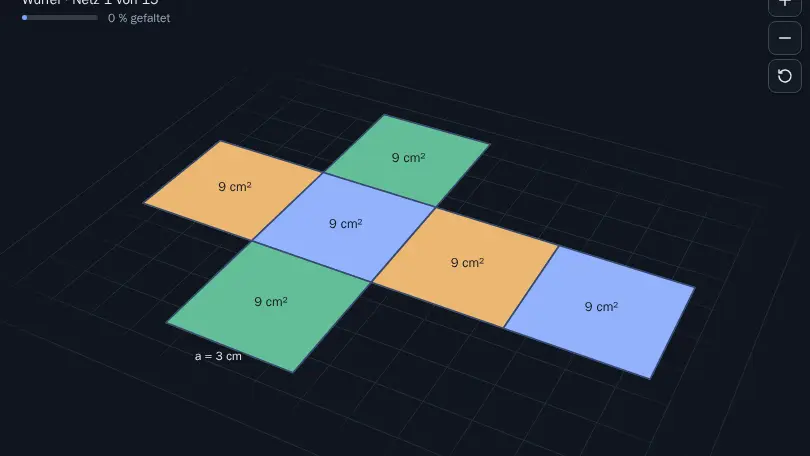
Fold nets of a cube, cuboid, prism, pyramid and cylinder into a solid in 3D and calculate the surface area.
Pour three times and the prism is full: a pyramid holds exactly one third. Cones and spheres can be turned and measured in 3D.
Transforming terms with the distributive law, solving linear equations with brackets and linear systems in two variables graphically and by trial.

The three binomial formulas as areas: a square splits into smaller squares and rectangles.
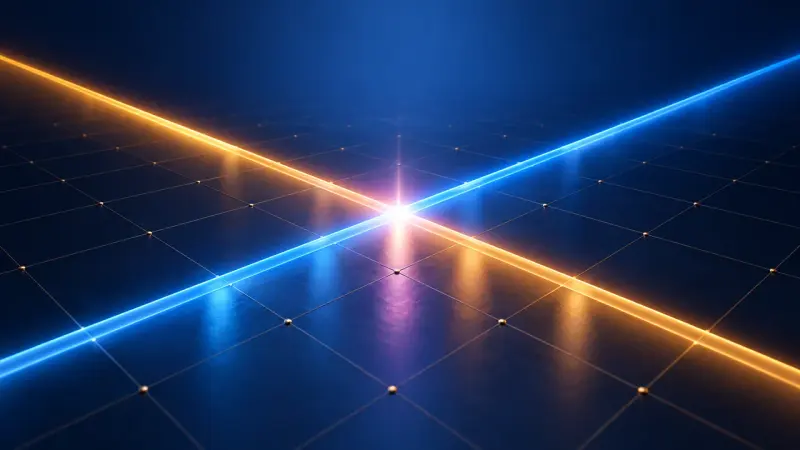
Two equations are two lines. Their point of intersection is the solution, which you can read off and check.
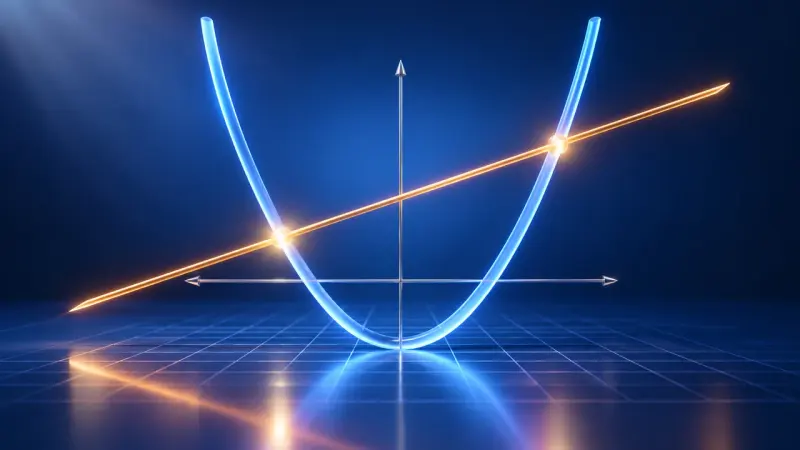
Draw both sides of an equation as graphs. The solutions are where the graphs cross.
Linear functions y = ax + b with slope, rate of change, zero and y-intercept, the effect of the parameters.

Change the slope and the y-intercept of a line and read off the slope triangle and the zero.

Exactly one y for every x? The arrow diagram, table and graph tell you straight away whether a relation is a function.

Up to three of your own functions at once, with a table of values, zeros and intersections. The tool for anything that can be a graph.
Choosing samples and variables, showing data in classes, box plots and histograms and comparing them.

One outlier pulls the mean away while the median barely moves. Dragging single data points shows which value is how robust.

Show the same data as bar, line and pie charts and more, and discover how charts can mislead.
Deepening counting problems and random experiments.

How many outfits or ice cream combinations are there? A tree diagram grows step by step and shows why you multiply the options.

Toss a coin, a die or a drawing pin a thousand times: the more often you throw, the closer the relative frequency gets to the probability.

Draw balls from an urn, with or without replacement. The tree diagram and the path rules show how to calculate probabilities.
The summaries describe the curriculum in our own words. The original text is authoritative. Original text (German): Rahmenlehrplan, Gymnasium, Mathematics, grade 8