

From secant to tangent
Let a point Q move towards P: the secant becomes the tangent, and the average slope becomes the derivative.
Qualification phase, first and second half-year (Q1, Q2; at the Gymnasium with Abitur after grade 12: grade 11). The curriculum assigns the standards to half-years by focus; moving between Q1 and Q2 and between Q2 and Q4 is allowed. LK = advanced course only. The numbers are our own.
Average and local rate of change, derivative and differentiation rules, analysing graphs and modelling with power, polynomial and exponential functions.
Secant and tangent slopes, the derivative as the local rate of change, the derivative function, constant, power, factor, sum, product and chain rules; derivative graph from the graph of the function and vice versa.
Let a point Q move towards P: the secant becomes the tangent, and the average slope becomes the derivative.

A tangent slides along the graph and draws its slope as a new graph: the derivative function.

What happens to a graph when x gets very large? A point runs outwards and a magnifier shows how close it gets to the asymptote.

Why is the number e so special? For the exponential function, the graph and its derivative are exactly the same.
Monotonicity, extrema and inflection points, reconstructing equations and optimisation problems with power, polynomial and exponential functions; LK: rational and further functions, asymptotes and families of functions.

Analyse a graph step by step: zeros, maximum and minimum points, inflection points and where it rises or falls.
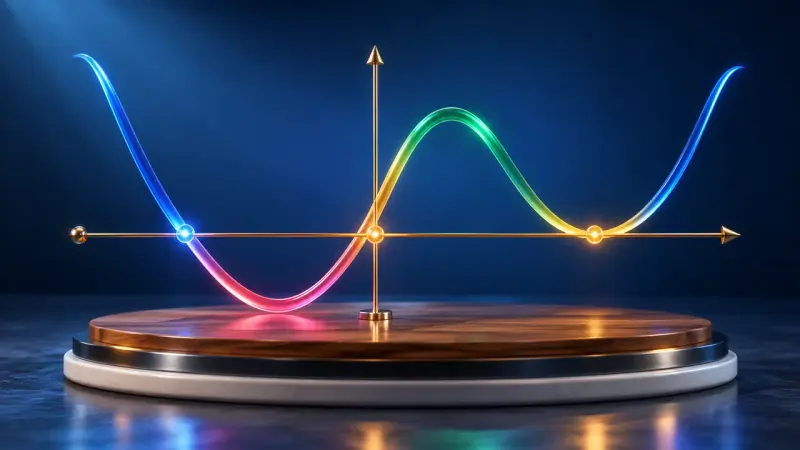
Does the graph cross the x-axis or only touch it? The multiplicity of the zero decides, the highest power decides what happens far out.

Even or odd, positive or negative: y = a · xⁿ changes with every exponent, and only a few points always stay the same.

Shift, stretch, reflect: every move of the graph leaves its mark in the function's equation.

Drag three points and the matching parabola always passes through all of them. The equation is worked out step by step.

Which box holds the most, which can uses the least metal? Five everyday problems show how to find the best solution with the derivative.

A zero or a pole, a hole or a leap to infinity? Drag the terms of the fraction and the graph shows the difference.

One parameter, infinitely many graphs. Where do the maxima go as k grows? Along a curve of their own, the locus.

Up to three of your own functions at once, with a table of values, zeros and intersections. The tool for anything that can be a graph.
The definite integral, the fundamental theorem and antiderivatives; measures of centre and spread, conditional probability, independence, urn models and simulations.
Reconstructing totals from rates of change, areas with definite integrals, justifying the fundamental theorem geometrically, antiderivatives; LK: ln as an antiderivative of 1/x, improper integrals and solids of revolution.

Fill the area under a graph with rectangles. The more rectangles, the more precisely you get the value of the integral.

The area under a graph grows as you move along. Its rate of change is exactly the function itself: this is the fundamental theorem.

The height of one graph becomes the slope of another. If you understand bank balances, the antiderivative comes quicker than you think.

From the speed of a car you get the distance travelled: the area under the curve shows the total change.
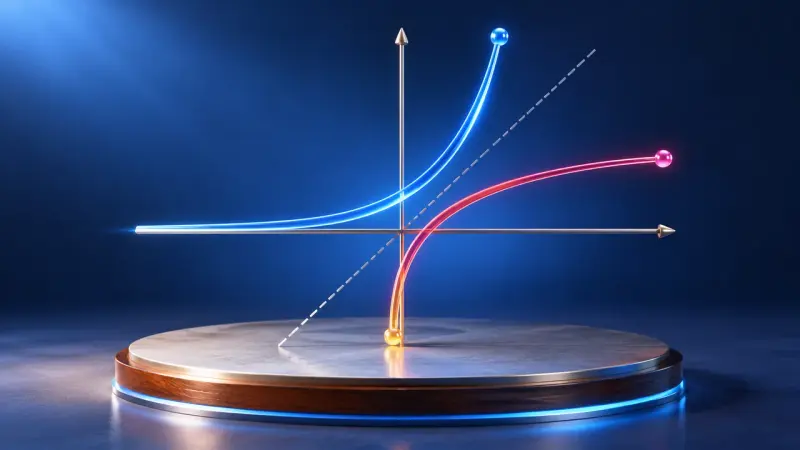
The logarithm answers the question: to what power do I raise the base to get this number? With graphs, rules and exponential equations.

Reflect the graph in y = x and the inverse function appears. It only works if no function value occurs twice.
Evaluating surveys, tree diagrams and two-way tables for conditional probabilities, stochastic independence, urn models with and without replacement and simulations.

A two-way table, a Venn diagram and a tree diagram show the same data and are linked. Change one and the others follow.

A medical test is positive, but how likely is it that you are really ill? 1000 people show why the answer is often surprising.

Play yourself or simulate thousands of games: is it worth switching doors?

How likely is it that two people in a class share a birthday? From just 23 people on, it is more likely than not.
The summaries describe the curriculum in our own words. The original text is authoritative. Original text (German): Rahmenlehrplan, Gymnasium, Mathematics, grade 11