

Expression trees: the structure of terms
An expression drawn as a tree: whatever hangs lowest is calculated first. The order of operations stops being a rule and becomes visible.
Section 3.2 covers the double grade 7/8; the same content is also listed under grade 8. Simulations are listed only where their grade range fits.
Percentages and interest, algebraic expressions and binomial formulas, square roots and the real numbers; solving linear equations and systems of equations.
Simplifying expressions with rational numbers in different forms and calculating their value.
An expression drawn as a tree: whatever hangs lowest is calculated first. The order of operations stops being a rule and becomes visible.
Visualising and calculating base value, percentage value and percentage rate; working out simple and compound interest step by step, also with a spreadsheet.

Discounts, VAT, surveys: one single bar holds the base value, the percentage and the part, one above the other.
Describing situations and sequences with variables, transforming expressions with the laws of arithmetic, expanding and factorising, using binomial formulas and rearranging formulas.

The three binomial formulas as areas: a square splits into smaller squares and rectangles.
An expression drawn as a tree: whatever hangs lowest is calculated first. The order of operations stops being a rule and becomes visible.
Understanding square roots as the inverse of squaring, estimating roots and simplifying expressions with roots; also cube roots.

Step by step, a rectangle turns into a square with the same area. The method is almost 2000 years old and reaches √2 surprisingly quickly.
Explaining why rational numbers are not sufficient, giving examples of irrational numbers and approximating a root with an iterative method, also digitally.
Step by step, a rectangle turns into a square with the same area. The method is almost 2000 years old and reaches √2 surprisingly quickly.
Solving linear equations by trial and equivalent transformations, solving linear systems in two variables and interpreting them graphically as intersections of lines; simple inequalities.

Solve linear equations on a balance: whatever you do to both sides keeps the scale balanced.

Two equations are two lines. Their point of intersection is the solution, which you can read off and check.
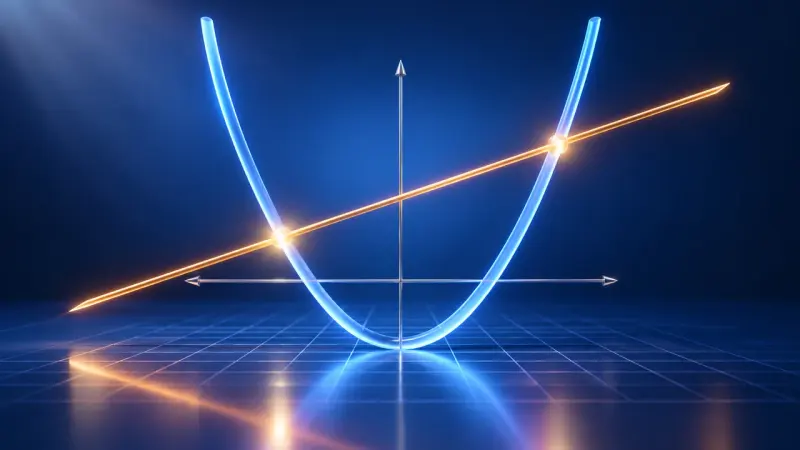
Draw both sides of an equation as graphs. The solutions are where the graphs cross.
The curriculum has no content for this guiding idea in grades 7/8.
No separate simulation is planned for this.
Angle theorems, constructing triangles and Thales’ theorem; loci, enlargements, intercept theorems and similarity, with reasoning and proof.
Using angles at intersecting and parallel lines, the angle sum of a triangle, the base angle theorem and Thales’ theorem; checking whether and how many triangles can be constructed.

Two lines cross and one of them turns. Which angles stay equal? At parallel lines they are called corresponding and alternate angles.

Tear off three corners, put them side by side, and you get a straight line: 180°, for every triangle. A quadrilateral gives 360°.

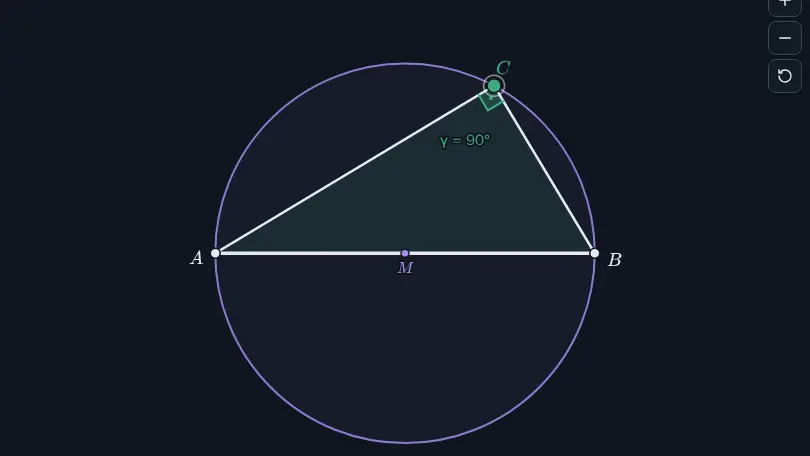
Drag a point along the semicircle: the angle there is always a right angle.
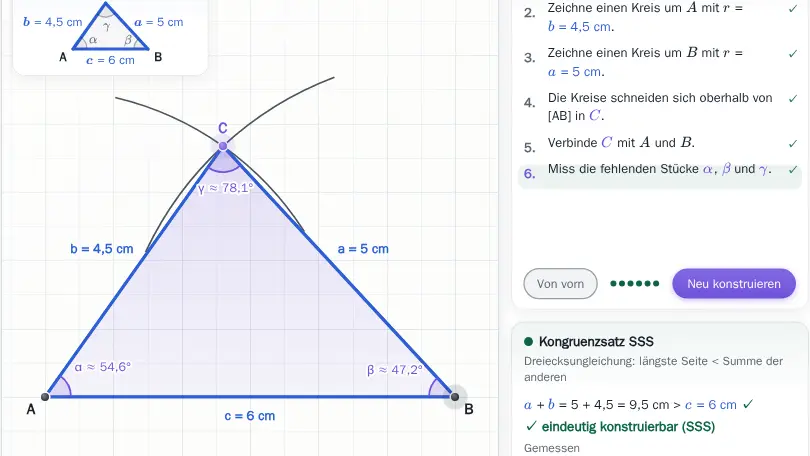
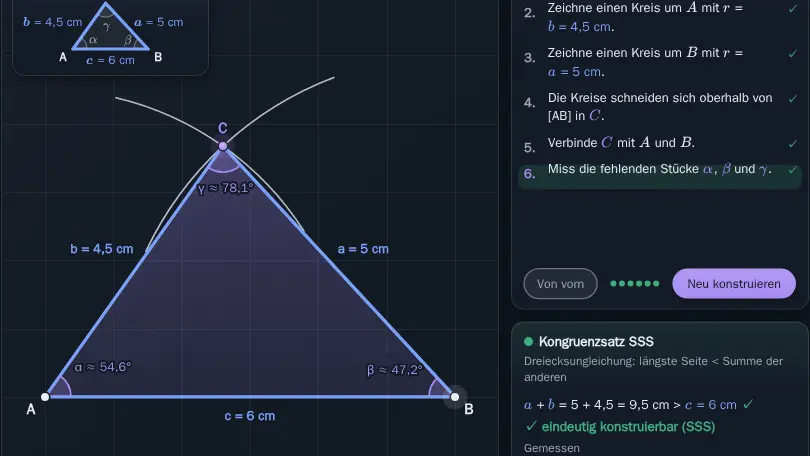
Construct triangles from three given parts with ruler and compass, step by step as in your exercise book. Sometimes there are no, one or two solutions.
Constructing perpendicular bisectors and angle bisectors with compass and ruler, solving problems with loci, finding circumcentre and incentre and constructing tangents to circles.

A point equally far from A and B never lies there by chance: the perpendicular bisector appears before you draw it with compasses.
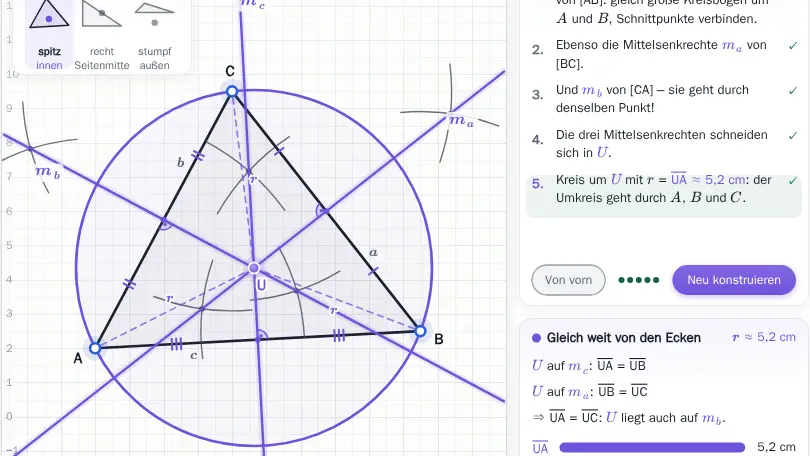

Construct the special lines in a triangle. Each set of three always meets in one point, for example at the centre of the circumcircle or the incircle.
Enlarging and reducing figures by central dilation and calculating lengths with the intercept theorems.
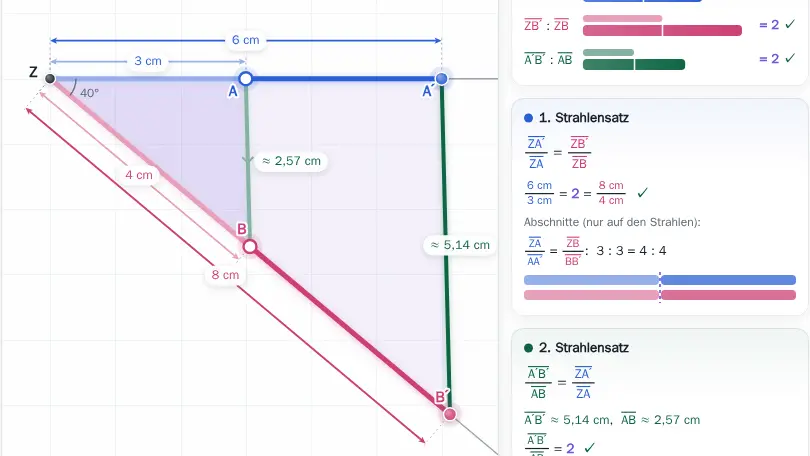
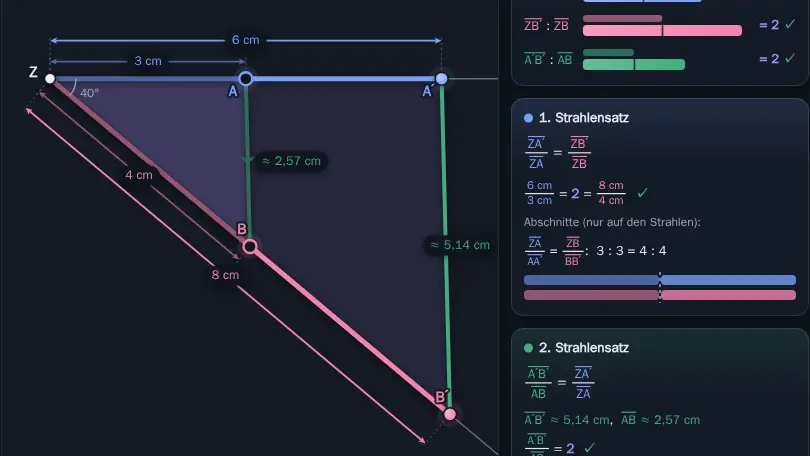
How tall is the tree without climbing it? Two rays and a parallel line are enough, because the ratios stay the same.

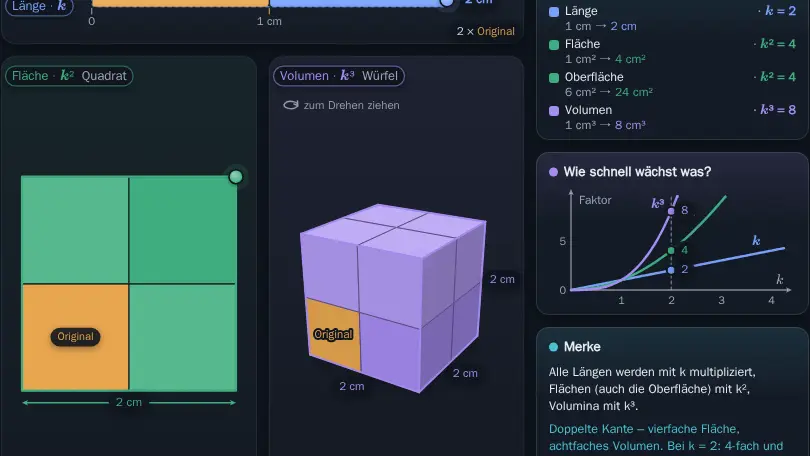
Enlarge lengths, areas and solids. Doubling the length makes the area four times and the volume eight times as large.
Checking figures for similarity and congruence, applying similarity criteria for triangles and using them to justify relationships and calculate lengths.
Construct triangles from three given parts with ruler and compass, step by step as in your exercise book. Sometimes there are no, one or two solutions.
Representing functions as unique assignments in tables, graphs, equations and words; investigating and applying linear functions with gradient and y-intercept.
Switching between table, equation, graph and words, reading values and trends, using direct and inverse proportion and distinguishing functions from other assignments.

Twice as many apples cost twice as much. Picture, table and graph show together when a relation is proportional, with the rule of three.

Exactly one y for every x? The arrow diagram, table and graph tell you straight away whether a relation is a function.
Drawing lines using a gradient triangle, finding the equation of a line through two points, interpreting the gradient as a rate of change and investigating how two lines lie.

Change the slope and the y-intercept of a line and read off the slope triangle and the zero.
Two equations are two lines. Their point of intersection is the solution, which you can read off and check.
Analysing data from sources and evaluating statements; finding probabilities from relative frequencies, Laplace experiments and tree diagrams.
Taking data for a question from secondary sources and formulating and critically evaluating statements based on them.

One outlier pulls the mean away while the median barely moves. Dragging single data points shows which value is how robust.

Show the same data as bar, line and pie charts and more, and discover how charts can mislead.
Describing outcomes and events, carrying out random experiments, interpreting relative frequencies as estimates (law of large numbers), counting possibilities and using complementary events, tree diagrams and path rules.

Toss a coin, a die or a drawing pin a thousand times: the more often you throw, the closer the relative frequency gets to the probability.

How many outfits or ice cream combinations are there? A tree diagram grows step by step and shows why you multiply the options.

Draw balls from an urn, with or without replacement. The tree diagram and the path rules show how to calculate probabilities.
The summaries describe the curriculum in our own words. The original text is authoritative. Original text (German): Bildungsplan, Gymnasium, Mathematics, grade 7/8