

Percentage bar
Discounts, VAT, surveys: one single bar holds the base value, the percentage and the part, one above the other.
MathematicsSaxony-Anhalt curriculum · Gymnasium
Grades 7/8: the curriculum describes both grades together, so the units are the same for grades 7 and 8, and both are shown as one stage. Units are the content areas with their focal points; the curriculum does not number them, the numbers are our own.
Percentages and interest, rational numbers and square roots, equations solved by equivalent transformations, and rearranging terms.
Finding base value, percentage value and rate, including discounts, interest and compound interest; percentages in pie charts.
Discounts, VAT, surveys: one single bar holds the base value, the percentage and the part, one above the other.
Calculating with positive and negative numbers, distinguishing number sets, taking roots and seeing that √2 is not rational.

A frog hops past zero into the negatives. Thermometers and bank balances show why minus 3 plus 5 makes exactly 2.

Step by step, a rectangle turns into a square with the same area. The method is almost 2000 years old and reaches √2 surprisingly quickly.
Solving linear equations, proportions and inequalities by equivalent transformations, rearranging formulas and applying them to word problems.
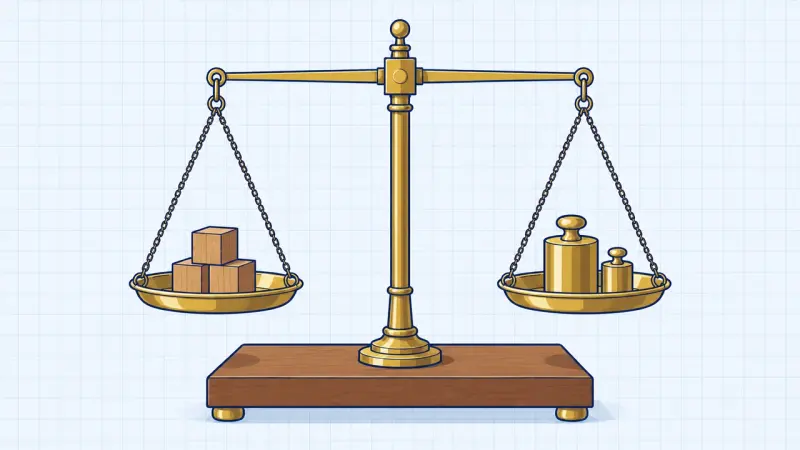
Solve linear equations on a balance: whatever you do to both sides keeps the scale balanced.
Recognising term structure, expanding, factoring and using the binomial formulas; simple proofs with variables.

An expression drawn as a tree: whatever hangs lowest is calculated first. The order of operations stops being a rule and becomes visible.

The three binomial formulas as areas: a square splits into smaller squares and rectangles.
Circles and circle angle theorems, drawing and calculating solids, similarity and the Pythagorean group of theorems.
Circles and lines, tangents, inscribed and central angle theorems, Thales’ theorem; circumference and area with π.

Drag a point along the semicircle: the angle there is always a right angle.

A wheel rolls once and travels a bit more than three times its diameter. Cut into pieces, the circle becomes a rectangle and the area formula follows.
Recognising prisms, pyramids, cylinders and cones and drawing them as nets, oblique drawings and two-view projections.

Fold nets of a cube, cuboid, prism, pyramid and cylinder into a solid in 3D and calculate the surface area.
Calculating surface area and volume of prisms, cylinders, pyramids, cones and spheres, including composite solids.

Layer by layer a prism grows upwards, and the curved surface of a cylinder unrolls into a rectangle.
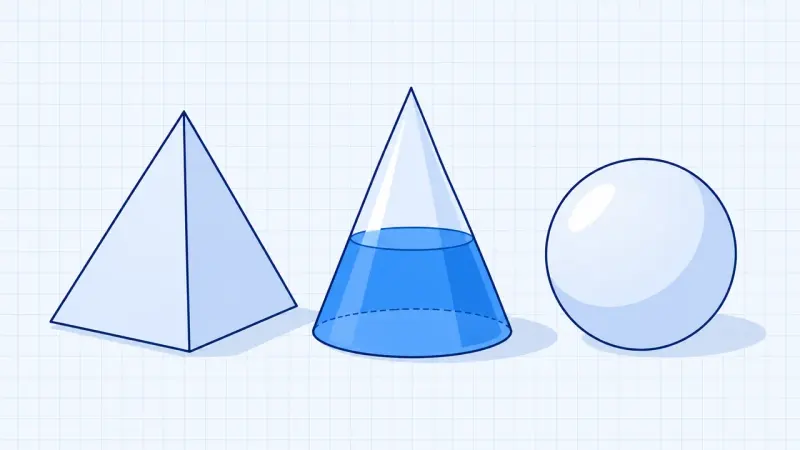
Pour three times and the prism is full: a pyramid holds exactly one third. Cones and spheres can be turned and measured in 3D.
Ratios of lengths and scale, enlargement from a centre, recognising similar figures and calculating lengths using similarity.

How tall is the tree without climbing it? Two rays and a parallel line are enough, because the ratios stay the same.

Enlarge lengths, areas and solids. Doubling the length makes the area four times and the volume eight times as large.
Setting up Pythagoras’ theorem, the altitude theorem and Euclid’s leg theorem and using them to find sides of right triangles.

Squares on the sides of a right triangle and a puzzle proof show: a² + b² = c².
The concept of a function, using linear functions with their representations and properties.
The concept of a function and its representations, slope and y-intercept, zeros and the intersection of two lines, by calculation and graphically.

Exactly one y for every x? The arrow diagram, table and graph tell you straight away whether a relation is a function.

Change the slope and the y-intercept of a line and read off the slope triangle and the zero.

Two equations are two lines. Their point of intersection is the solution, which you can read off and check.
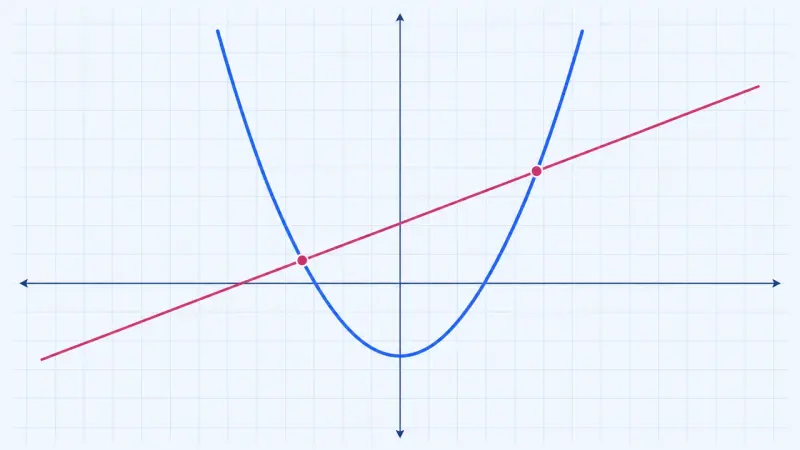
Draw both sides of an equation as graphs. The solutions are where the graphs cross.
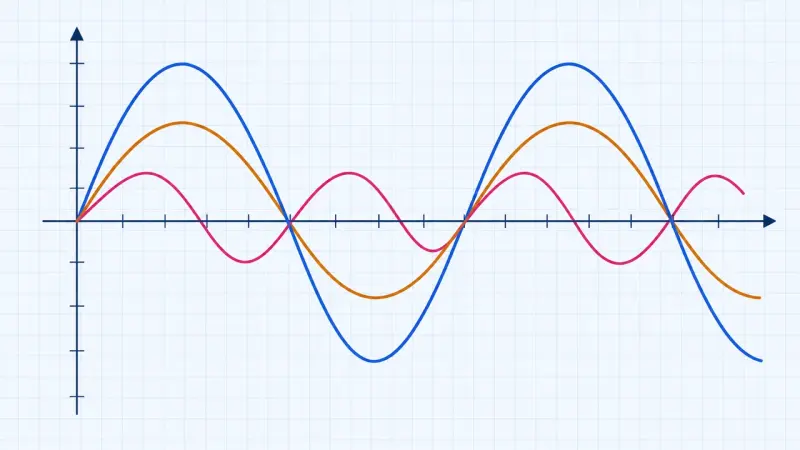
Up to three of your own functions at once, with a table of values, zeros and intersections. The tool for anything that can be a graph.
Random experiments, frequencies and probabilities, including multi-stage experiments with tree diagrams.
Carrying out and simulating random experiments, using relative frequencies as estimates, showing events in Venn diagrams and two-way tables, calculating Laplace probabilities.

Toss a coin, a die or a drawing pin a thousand times: the more often you throw, the closer the relative frequency gets to the probability.

Random points fall on a square with a circle inside. From the share inside the circle you can estimate π.

A two-way table, a Venn diagram and a tree diagram show the same data and are linked. Change one and the others follow.
Showing multi-stage experiments in tree diagrams, applying the path rules, using urn models with and without replacement.

How many outfits or ice cream combinations are there? A tree diagram grows step by step and shows why you multiply the options.

Draw balls from an urn, with or without replacement. The tree diagram and the path rules show how to calculate probabilities.

How likely is it that two people in a class share a birthday? From just 23 people on, it is more likely than not.
The summaries describe the curriculum in our own words. The original text is authoritative. Original text (German): Fachlehrplan, Gymnasium, Mathematics, grade 7/8