

Square roots and Heron’s method
Step by step, a rectangle turns into a square with the same area. The method is almost 2000 years old and reaches √2 surprisingly quickly.
MathematicsSaxony-Anhalt curriculum · Gymnasium
Grade 9. Units are the content areas with their focal points; the curriculum does not number them, the numbers are our own.
Powers with rational exponents, roots and logarithms.
Applying the laws of powers, roots and logarithms, translating between the three notations and writing numbers in scientific notation.
Step by step, a rectangle turns into a square with the same area. The method is almost 2000 years old and reaches √2 surprisingly quickly.

The logarithm answers the question: to what power do I raise the base to get this number? With graphs, rules and exponential equations.
Calculations in triangles with sine, cosine and tangent.
Sine, cosine and tangent in right triangles, the sine rule, cosine rule and area formula for any triangle.
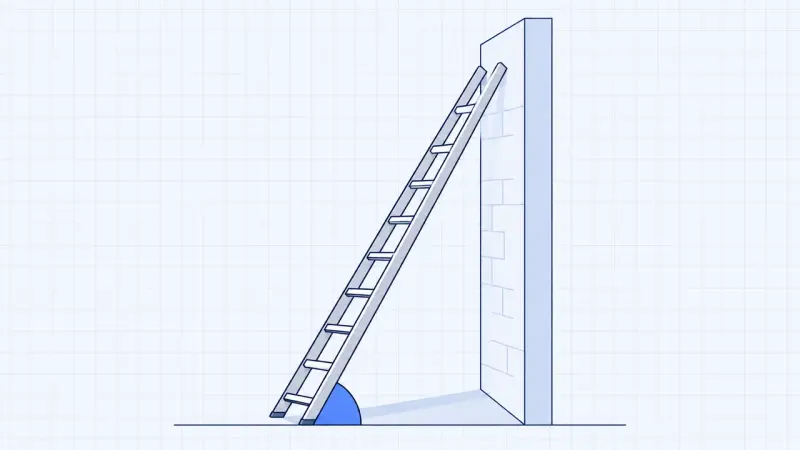
In a right triangle, the ratio of two sides depends only on the angle. This gives sine, cosine and tangent, with examples such as ramps and ladders.

Calculate sides and angles in any triangle with the law of sines and the law of cosines. A helper shows which law fits your problem.
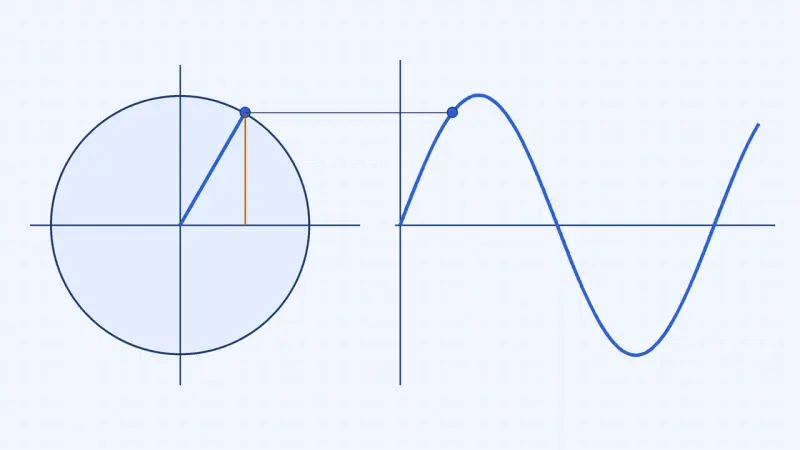
Sine, cosine and tangent on the unit circle, and how the sine curve grows out of it.
Quadratic equations and functions and their applications.
Solving quadratic equations and examining how many solutions they have, drawing parabolas, finding vertex and zeros and describing the effect of the parameters.

Stretch, reflect and shift parabolas and read off the vertex and the zeros.

Drag three points and the matching parabola always passes through all of them. The equation is worked out step by step.
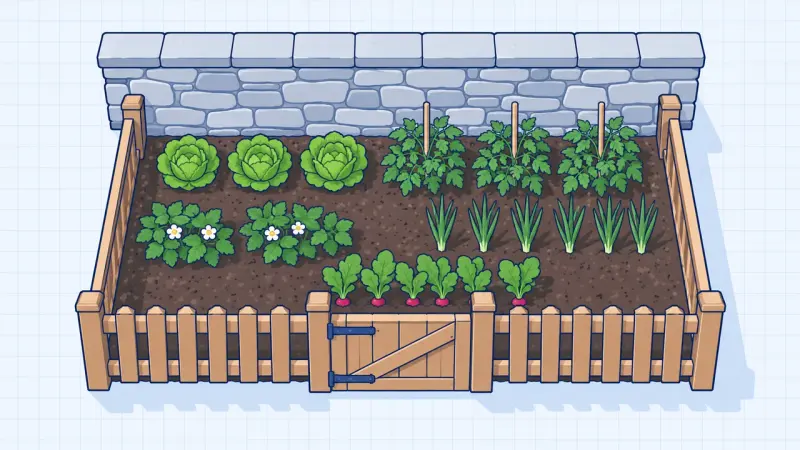
Which enclosure has the largest area? Picture and graph show the maximum, first by trying, then by exact calculation.
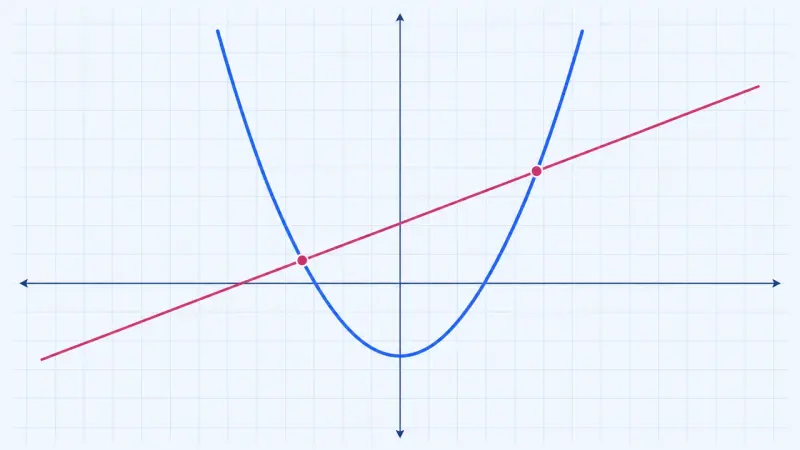
Draw both sides of an equation as graphs. The solutions are where the graphs cross.
Displaying frequency distributions and describing them with measures of centre and spread.
Grouping data into classes and showing them as histograms or box plots, finding measures of centre and spread and also creating distributions by simulation.
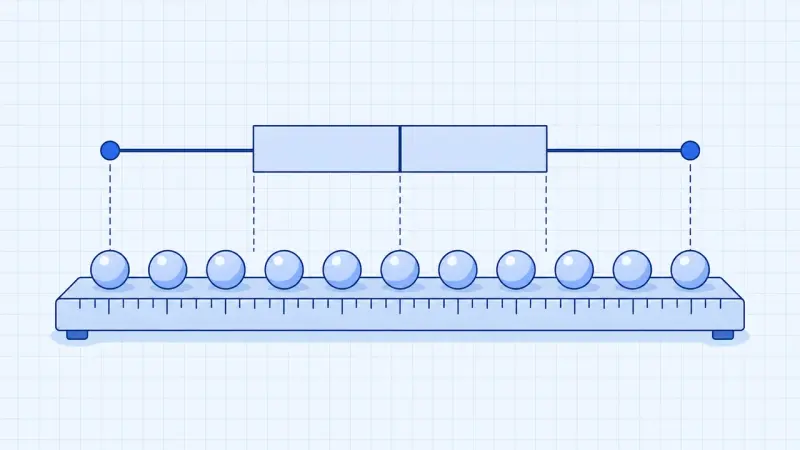
One outlier pulls the mean away while the median barely moves. Dragging single data points shows which value is how robust.

Toss a coin, a die or a drawing pin a thousand times: the more often you throw, the closer the relative frequency gets to the probability.
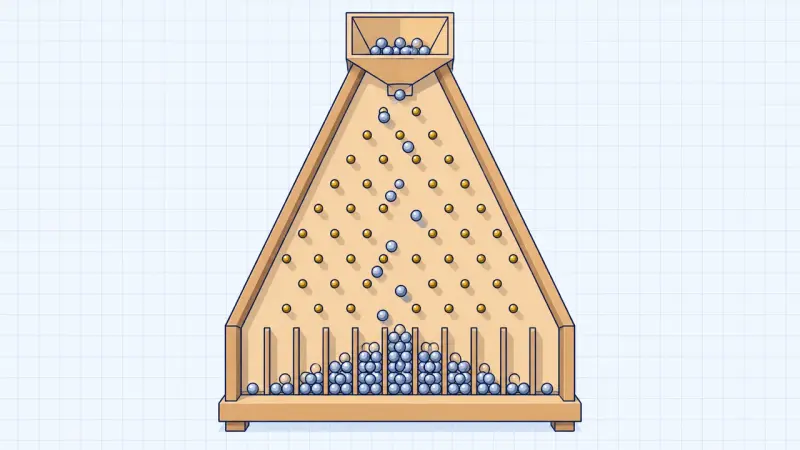
Left or right at every pin, purely by chance. Yet every time the balls pile up into the same bell shape.
The summaries describe the curriculum in our own words. The original text is authoritative. Original text (German): Fachlehrplan, Gymnasium, Mathematics, grade 9