

Power functions y = a · xⁿ
Even or odd, positive or negative: y = a · xⁿ changes with every exponent, and only a few points always stay the same.
In Saxony-Anhalt, grade 10 is the introductory phase of upper secondary (Abitur after grade 12). From here on the content areas are calculus, analytic geometry and probability and statistics; the numbers are our own.
Important families of functions with their graphs, properties and parameters as a basis for calculus.
Power, exponential, sine and cosine functions, and in simple cases root and logarithmic functions: graphs, properties, effect of parameters, inverse functions, growth and periodic processes.
Even or odd, positive or negative: y = a · xⁿ changes with every exponent, and only a few points always stay the same.

The hyperbola gets ever closer to its asymptotes and yet never touches them. Shifting and stretching show what the parameters do.
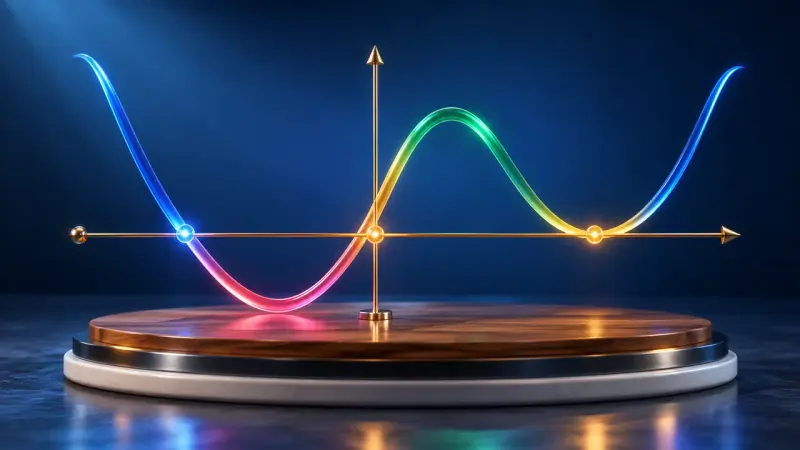
Does the graph cross the x-axis or only touch it? The multiplicity of the zero decides, the highest power decides what happens far out.

Water lilies on a pond, compound interest and decay: exponential growth compared with linear growth.
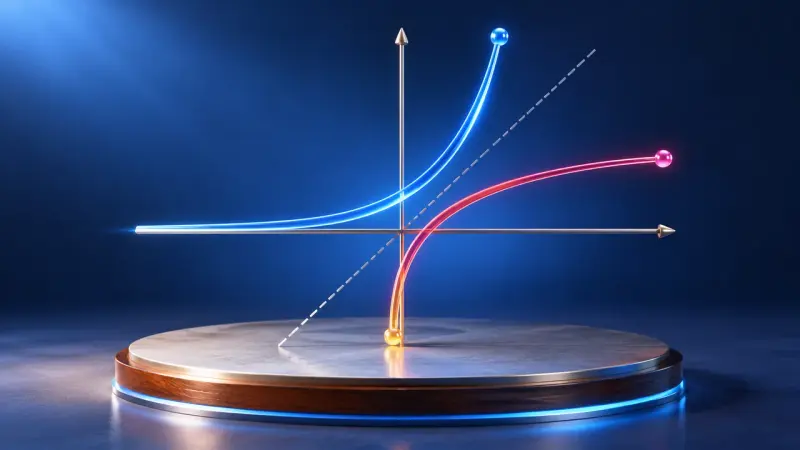
The logarithm answers the question: to what power do I raise the base to get this number? With graphs, rules and exponential equations.

Sine, cosine and tangent on the unit circle, and how the sine curve grows out of it.

Change the amplitude, period and shift of a sine curve with sliders or by dragging.

Shift, stretch, reflect: every move of the graph leaves its mark in the function's equation.

Reflect the graph in y = x and the inverse function appears. It only works if no function value occurs twice.

What happens to a graph when x gets very large? A point runs outwards and a magnifier shows how close it gets to the asymptote.

Up to three of your own functions at once, with a table of values, zeros and intersections. The tool for anything that can be a graph.
Vectors in the 3D coordinate system and calculating with them.
The 3D coordinate system, adding and scaling vectors, linear dependence, systems of equations in three variables, dot product, angles and cross product.

Place points in 3D coordinates, rotate the view and calculate distances with Pythagoras' theorem.

Drag vector arrows in space, add them and multiply them by numbers. The calculation is shown alongside in column form.

The dot product tells you the angle between two vectors; the cross product gives a perpendicular vector and an area.
Random variables with their distribution, expected value and standard deviation.
Describing events with random variables, setting up probability distributions, calculating and interpreting expected value and standard deviation.
No separate simulation is planned for this.
The summaries describe the curriculum in our own words. The original text is authoritative. Original text (German): Fachlehrplan, Gymnasium, Mathematics, grade 10