

Function plotter with custom terms
Up to three of your own functions at once, with a table of values, zeros and intersections. The tool for anything that can be a graph.
Studienstufe, first year (S1/S2; at the Gymnasium with Abitur after grade 12: grade 11): modules 1.1, 1.2, 2 and 3. Module 1.2 may also be taught before module 4, and the binomial distribution from module 5 right after module 2. eA = higher level only. The numbers are the module numbers of the curriculum.
Polynomial, simple rational and root functions with parameters, symmetry, behaviour at infinity and asymptotes, rules of differentiation, curve sketching and optimisation, the integral, antiderivatives and the fundamental theorem; eA: families of functions, solids of revolution.
Up to three of your own functions at once, with a table of values, zeros and intersections. The tool for anything that can be a graph.
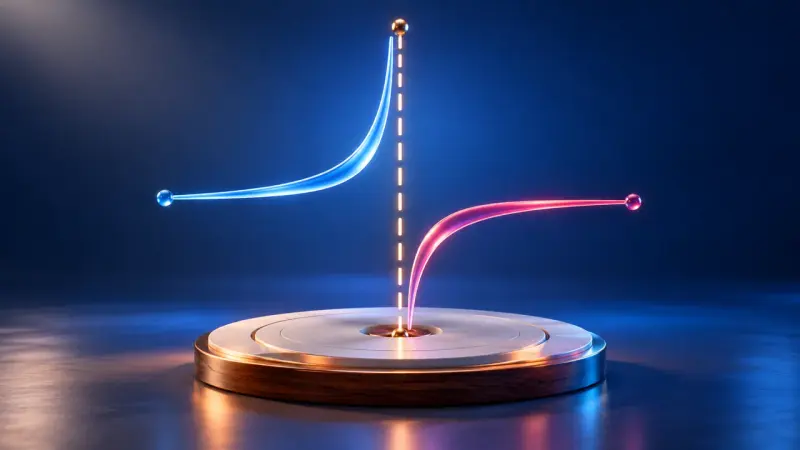
A zero or a pole, a hole or a leap to infinity? Drag the terms of the fraction and the graph shows the difference.
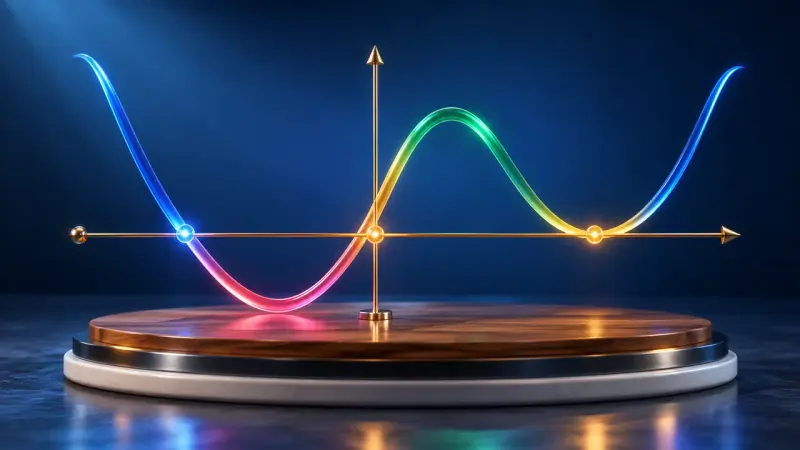
Does the graph cross the x-axis or only touch it? The multiplicity of the zero decides, the highest power decides what happens far out.
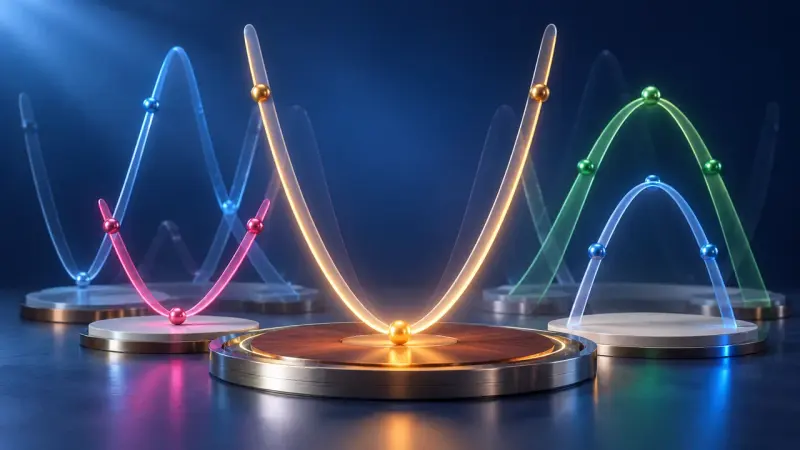
Shift, stretch, reflect: every move of the graph leaves its mark in the function's equation.

What happens to a graph when x gets very large? A point runs outwards and a magnifier shows how close it gets to the asymptote.

Let a point Q move towards P: the secant becomes the tangent, and the average slope becomes the derivative.

A tangent slides along the graph and draws its slope as a new graph: the derivative function.

Analyse a graph step by step: zeros, maximum and minimum points, inflection points and where it rises or falls.

Which box holds the most, which can uses the least metal? Five everyday problems show how to find the best solution with the derivative.

One parameter, infinitely many graphs. Where do the maxima go as k grows? Along a curve of their own, the locus.

The height of one graph becomes the slope of another. If you understand bank balances, the antiderivative comes quicker than you think.

Fill the area under a graph with rectangles. The more rectangles, the more precisely you get the value of the integral.

The area under a graph grows as you move along. Its rate of change is exactly the function itself: this is the fundamental theorem.

From the speed of a car you get the distance travelled: the area under the curve shows the total change.
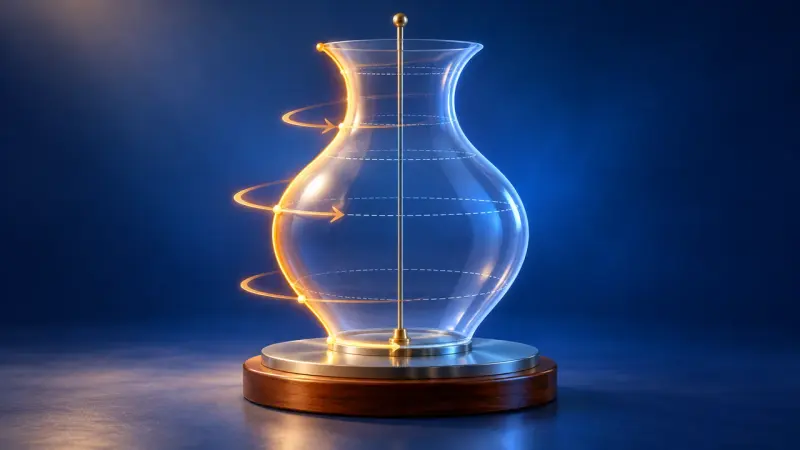
The area under a graph rotates about the x-axis and becomes a solid. Its volume is calculated with thin discs.
Sine and cosine functions with parameters in context, their derivatives and antiderivatives, the product and chain rules, areas.

Change the amplitude, period and shift of a sine curve with sliders or by dragging.
Shift, stretch, reflect: every move of the graph leaves its mark in the function's equation.
Relative frequency and probability, measures of centre and spread with variance and standard deviation, tree diagrams and two-way tables, stochastic independence, simulations.

A two-way table, a Venn diagram and a tree diagram show the same data and are linked. Change one and the others follow.

A medical test is positive, but how likely is it that you are really ill? 1000 people show why the answer is often surprising.

How likely is it that two people in a class share a birthday? From just 23 people on, it is more likely than not.

Play yourself or simulate thousands of games: is it worth switching doors?

Left or right at every pin, purely by chance. Yet every time the balls pile up into the same bell shape.
Vectors in the plane and in space, position vectors, points and objects in the coordinate system, calculating with vectors; eA: magnitude and dot product.
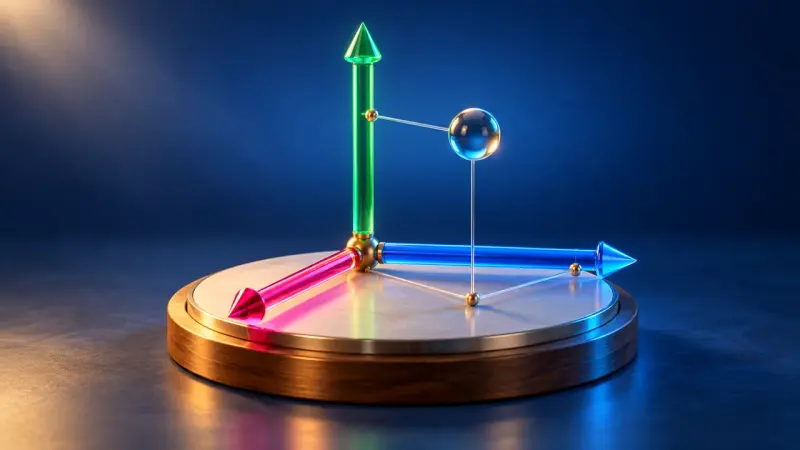
Place points in 3D coordinates, rotate the view and calculate distances with Pythagoras' theorem.

Drag vector arrows in space, add them and multiply them by numbers. The calculation is shown alongside in column form.
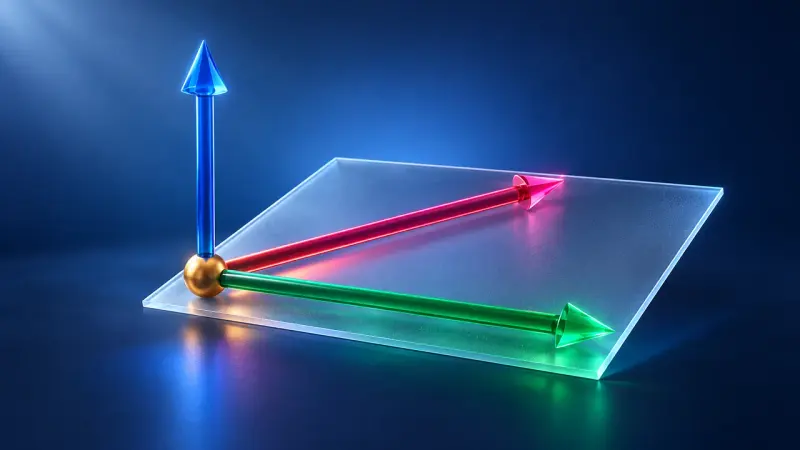
The dot product tells you the angle between two vectors; the cross product gives a perpendicular vector and an area.
The summaries describe the curriculum in our own words. The original text is authoritative. Original text (German): Bildungsplan, Gymnasium, Mathematics, grade 11