
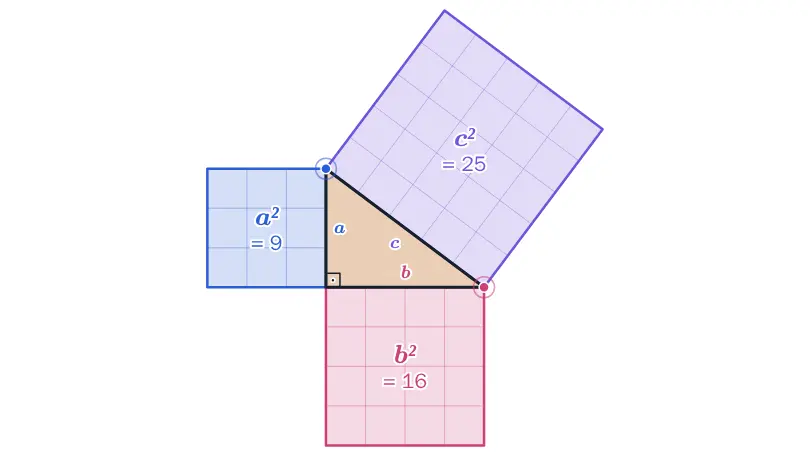

Pythagorean theorem
Squares on the sides of a right triangle and a puzzle proof show: a² + b² = c².
Grades 9/10: the teaching modules are to be covered in the given order; the units are the same for grades 9 and 10 and are shown as one stage. Modules 9 and 10 both carry the title “Exponential growth” in the curriculum. The numbers are the module numbers of the curriculum.
Pythagoras’ theorem and its converse, calculating side lengths, applications and proof.
Squares on the sides of a right triangle and a puzzle proof show: a² + b² = c².
Nets and oblique drawings, surface area and volume of pyramid, cone and sphere, Cavalieri’s principle, deriving the volume formulas.

Pour three times and the prism is full: a pyramid holds exactly one third. Cones and spheres can be turned and measured in 3D.

Push a stack of coins sideways: the shape changes, but the volume stays the same. This is Cavalieri's principle.
Quadratic functions in context, forms of the term and the effect of parameters, solving quadratic equations numerically, graphically and algebraically.

Stretch, reflect and shift parabolas and read off the vertex and the zeros.

Drag three points and the matching parabola always passes through all of them. The equation is worked out step by step.

Which enclosure has the largest area? Picture and graph show the maximum, first by trying, then by exact calculation.
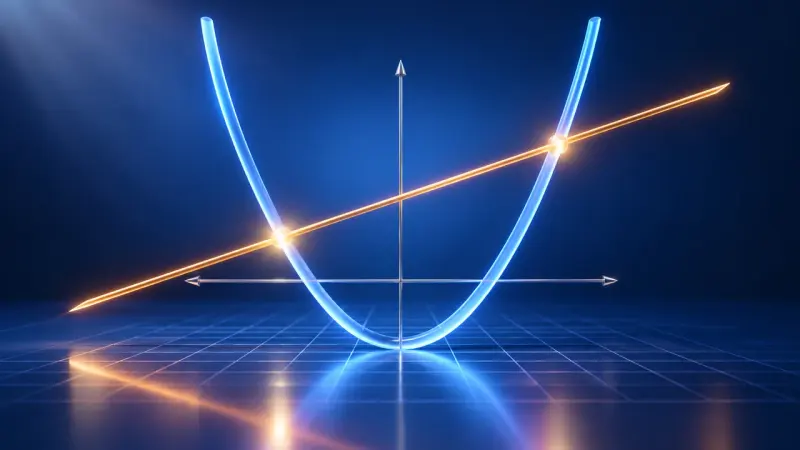
Draw both sides of an equation as graphs. The solutions are where the graphs cross.
Scientific notation, explaining and proving the laws of exponents, negative and rational exponents, roots as powers.

Step by step, a rectangle turns into a square with the same area. The method is almost 2000 years old and reaches √2 surprisingly quickly.
Multi-stage random experiments with path rules, complementary probability and expected value, counting principles, conditional probability with two-way tables and tree diagrams.

How many outfits or ice cream combinations are there? A tree diagram grows step by step and shows why you multiply the options.

Draw balls from an urn, with or without replacement. The tree diagram and the path rules show how to calculate probabilities.

How likely is it that two people in a class share a birthday? From just 23 people on, it is more likely than not.

A two-way table, a Venn diagram and a tree diagram show the same data and are linked. Change one and the others follow.

A medical test is positive, but how likely is it that you are really ill? 1000 people show why the answer is often surprising.

Play yourself or simulate thousands of games: is it worth switching doors?
Similarity and congruence, scale factors for lengths, areas and solids, similar triangles, intercept theorems.
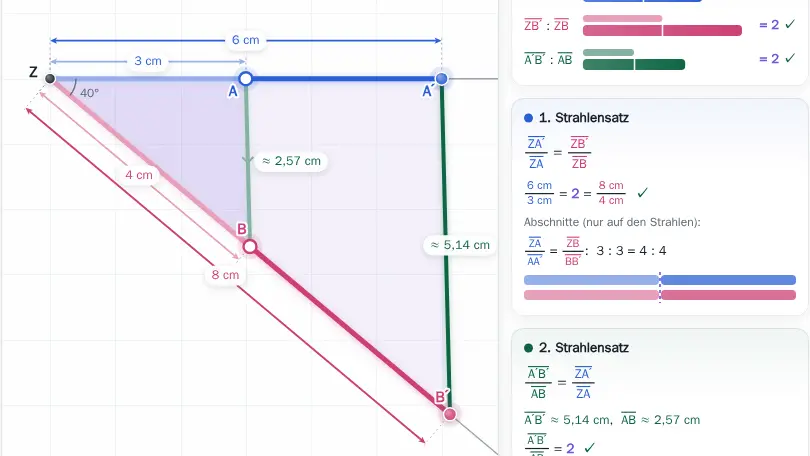
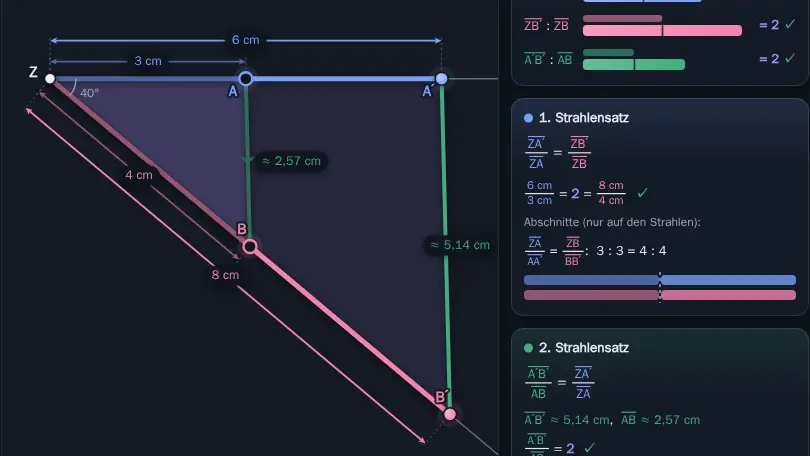
How tall is the tree without climbing it? Two rays and a parallel line are enough, because the ratios stay the same.

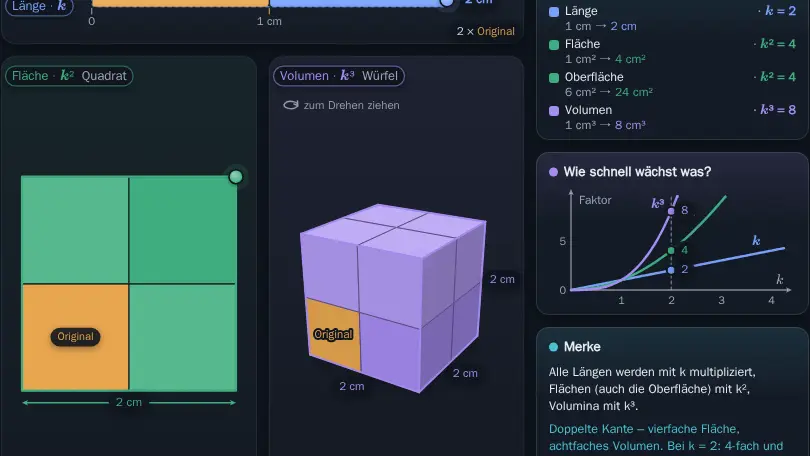
Enlarge lengths, areas and solids. Doubling the length makes the area four times and the volume eight times as large.
Sine, cosine and tangent in right triangles, calculating angles and sides, relationships in general triangles.

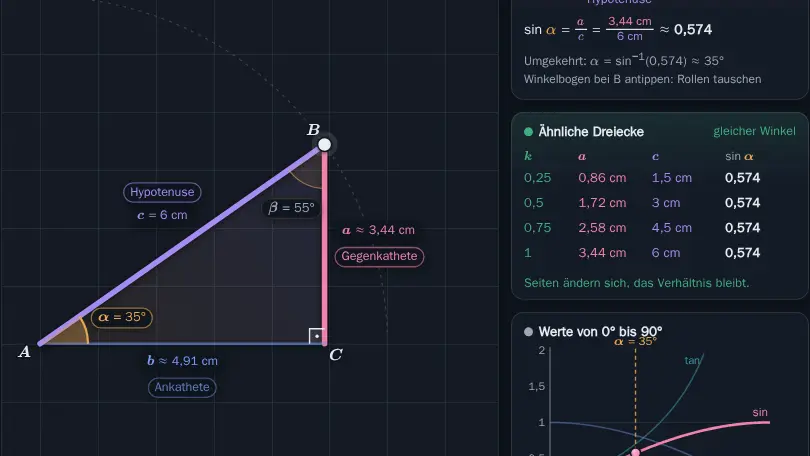
In a right triangle, the ratio of two sides depends only on the angle. This gives sine, cosine and tangent, with examples such as ramps and ladders.

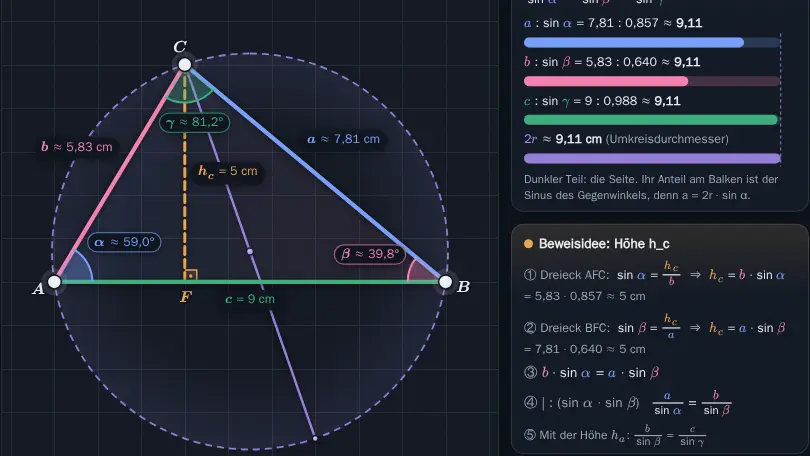
Calculate sides and angles in any triangle with the law of sines and the law of cosines. A helper shows which law fits your problem.
Circular motion and its projections, the sine and cosine functions, the effect of parameters, describing periodic processes.

Sine, cosine and tangent on the unit circle, and how the sine curve grows out of it.

Change the amplitude, period and shift of a sine curve with sliders or by dragging.
Telling linear and exponential growth apart, exponential functions in context and how to represent them, the logarithm as the inverse of taking powers.
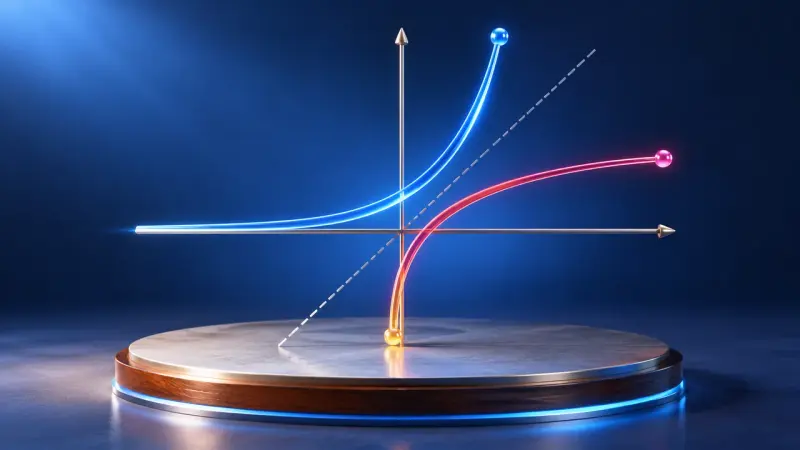
The logarithm answers the question: to what power do I raise the base to get this number? With graphs, rules and exponential equations.

Water lilies on a pond, compound interest and decay: exponential growth compared with linear growth.
Exponential functions of the form f(x) = a · bˣ in context, switching representations and features, logarithms on the calculator.
The logarithm answers the question: to what power do I raise the base to get this number? With graphs, rules and exponential equations.
Water lilies on a pond, compound interest and decay: exponential growth compared with linear growth.
Practice and consolidation across all key ideas and process skills with a view to the exam.
No separate simulation is planned for this.
Comparing known and new functions, polynomial and simple rational functions, zeros and substitution, the square root function as an inverse function.

Up to three of your own functions at once, with a table of values, zeros and intersections. The tool for anything that can be a graph.

The hyperbola gets ever closer to its asymptotes and yet never touches them. Shifting and stretching show what the parameters do.

Even or odd, positive or negative: y = a · xⁿ changes with every exponent, and only a few points always stay the same.
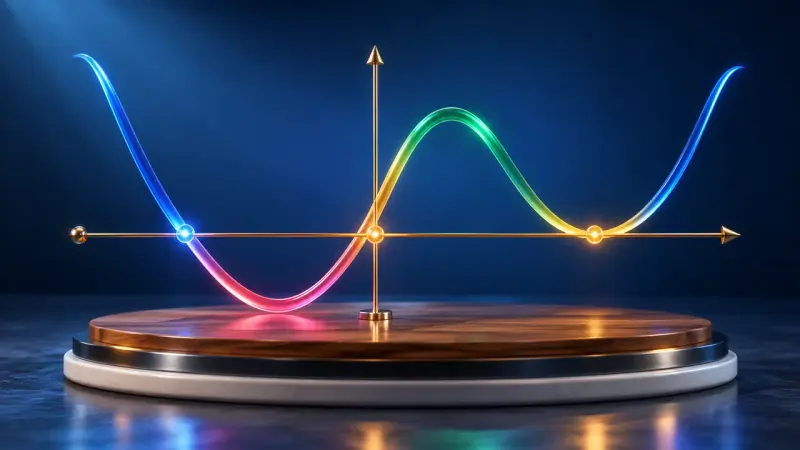
Does the graph cross the x-axis or only touch it? The multiplicity of the zero decides, the highest power decides what happens far out.

Shift, stretch, reflect: every move of the graph leaves its mark in the function's equation.

Reflect the graph in y = x and the inverse function appears. It only works if no function value occurs twice.
Average and local rate of change, the slope of the tangent from the difference quotient, the derivative function, the tangent equation and angle of slope.

Let a point Q move towards P: the secant becomes the tangent, and the average slope becomes the derivative.

A tangent slides along the graph and draws its slope as a new graph: the derivative function.
The summaries describe the curriculum in our own words. The original text is authoritative. Original text (German): Bildungsplan, Gymnasium, Mathematics, grade 9/10