

Families of functions
One parameter, infinitely many graphs. Where do the maxima go as k grows? Along a curve of their own, the locus.
This refers to the higher level of requirements (“erhöhtes Anforderungsniveau”).
Investigating families of functions and sketching an antiderivative from a graph.
One parameter, infinitely many graphs. Where do the maxima go as k grows? Along a curve of their own, the locus.

The height of one graph becomes the slope of another. If you understand bank balances, the antiderivative comes quicker than you think.
The function that is its own derivative; product and chain rule, growth and decay.

Why is the number e so special? For the exponential function, the graph and its derivative are exactly the same.
Making the derivatives of sine and cosine plausible graphically.

A tangent slides along the graph and draws its slope as a new graph: the derivative function.
Random variables, expected value and standard deviation, urn models, Bernoulli trials and the binomial distribution.

The histogram of the binomial distribution: choose a range and read off the probability directly.

Left or right at every pin, purely by chance. Yet every time the balls pile up into the same bell shape.
Procedure of a significance test, critical region, type I and type II errors and interpreting results correctly.
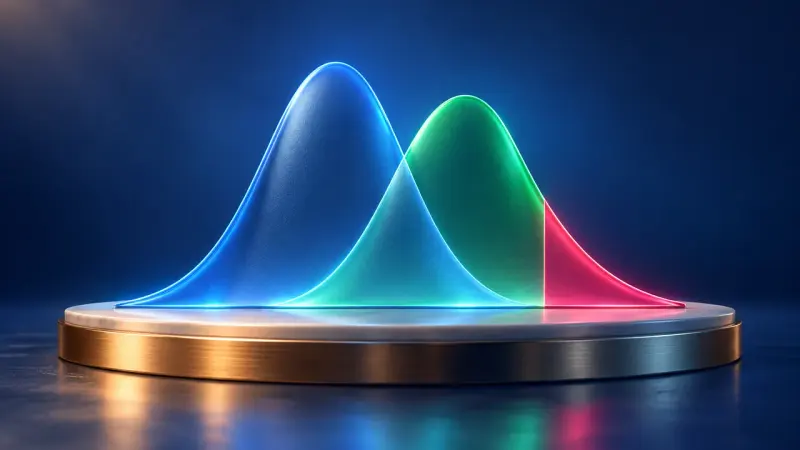
A test decides between two hypotheses. Coloured areas show how often it can be wrong.
Differentiating with the quotient rule and investigating simple rational functions.
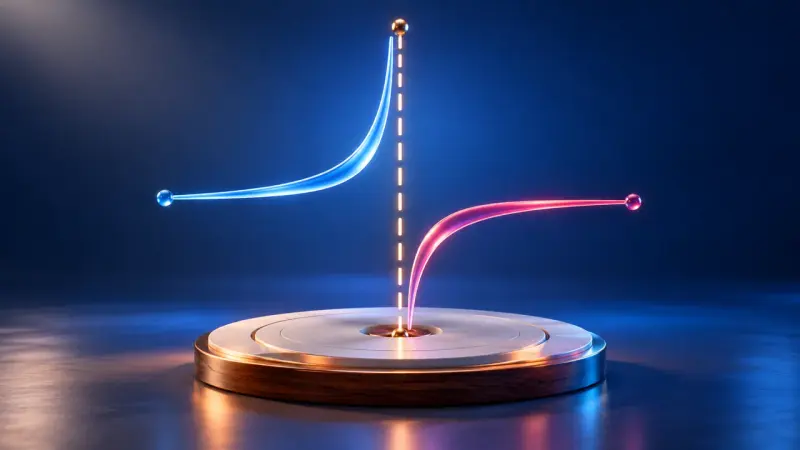
A zero or a pole, a hole or a leap to infinity? Drag the terms of the fraction and the graph shows the difference.
Invertibility via strict monotonicity, square and square root functions as inverses.

Reflect the graph in y = x and the inverse function appears. It only works if no function value occurs twice.
The natural logarithm as the inverse of the exponential function and its derivative.
Reflect the graph in y = x and the inverse function appears. It only works if no function value occurs twice.
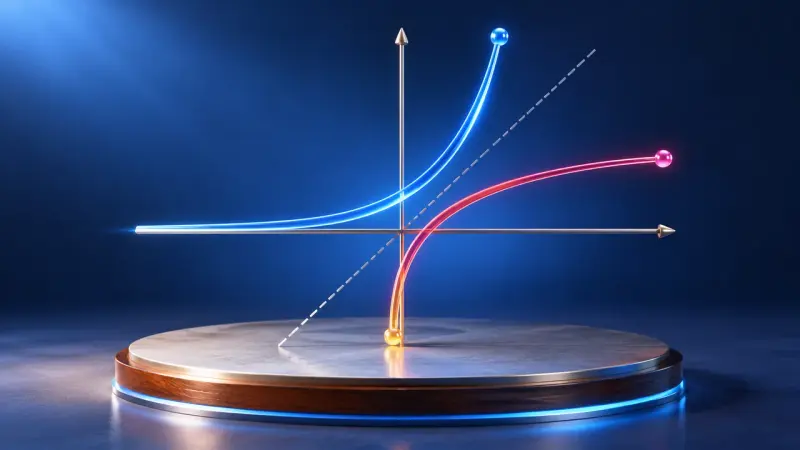
The logarithm answers the question: to what power do I raise the base to get this number? With graphs, rules and exponential equations.
3D coordinates, adding and scaling vectors, dot product (lengths and angles) and cross product (areas and volumes).
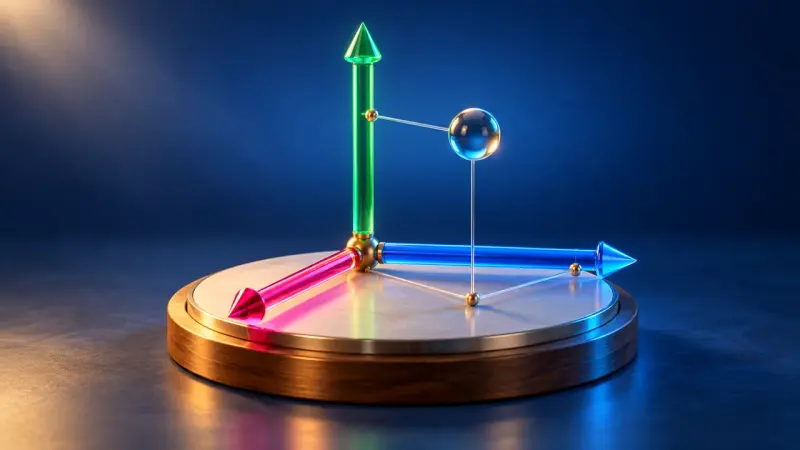
Place points in 3D coordinates, rotate the view and calculate distances with Pythagoras' theorem.

Drag vector arrows in space, add them and multiply them by numbers. The calculation is shown alongside in column form.
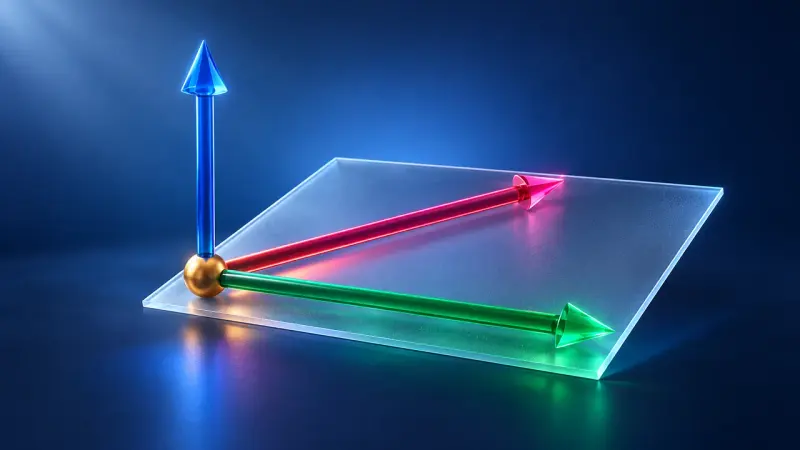
The dot product tells you the angle between two vectors; the cross product gives a perpendicular vector and an area.
The summaries describe the curriculum in our own words. The original text is authoritative. Original text (German): LehrplanPLUS, Gymnasium, Mathematics, grade 12