

Power functions y = a · xⁿ
Even or odd, positive or negative: y = a · xⁿ changes with every exponent, and only a few points always stay the same.
Introductory phase of upper secondary (G9: grade 11). The letters A and G are the curriculum’s labels for the content areas; the numbers of the focal points are our own. Core curriculum for upper secondary of 2026, in force from 1 August 2027, starting with the introductory phase; the 2023 core curriculum is being phased out and is not shown here.
Power functions and polynomial functions, transformations, the step from average to instantaneous rate of change and analysing graphs with the derivative.
Power functions with integer exponents and polynomial functions; solving polynomial equations by factoring out.
Even or odd, positive or negative: y = a · xⁿ changes with every exponent, and only a few points always stay the same.
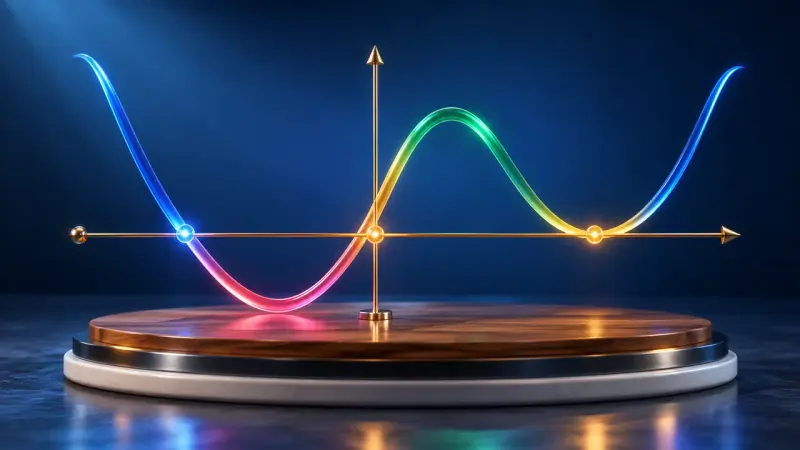
Does the graph cross the x-axis or only touch it? The multiplicity of the zero decides, the highest power decides what happens far out.

Up to three of your own functions at once, with a table of values, zeros and intersections. The tool for anything that can be a graph.
Shape of the graph, domain and range, zeros, symmetry and behaviour for large x.
Does the graph cross the x-axis or only touch it? The multiplicity of the zero decides, the highest power decides what happens far out.

What happens to a graph when x gets very large? A point runs outwards and a magnifier shows how close it gets to the asymptote.
Reflecting, shifting and stretching along both axes, including the sine function; interpreting parameters.

Shift, stretch, reflect: every move of the graph leaves its mark in the function's equation.

Change the amplitude, period and shift of a sine curve with sliders or by dragging.
Average and instantaneous rate of change, secant and tangent, sketching the derivative graphically.

Let a point Q move towards P: the secant becomes the tangent, and the average slope becomes the derivative.

A tangent slides along the graph and draws its slope as a new graph: the derivative function.
Power, sum and constant-multiple rules, monotonicity, local and global extrema, curvature and points of inflection.

Analyse a graph step by step: zeros, maximum and minimum points, inflection points and where it rises or falls.
A tangent slides along the graph and draws its slope as a new graph: the derivative function.
Points and vectors in a three-dimensional coordinate system, calculating with vectors, lines in parametric form and their relative positions.
Points, position vectors and vectors in a three-dimensional coordinate system.

Place points in 3D coordinates, rotate the view and calculate distances with Pythagoras' theorem.

Drag vector arrows in space, add them and multiply them by numbers. The calculation is shown alongside in column form.
Addition and multiplication by a scalar.
Drag vector arrows in space, add them and multiply them by numbers. The calculation is shown alongside in column form.
Length and distance using Pythagoras’ theorem, collinearity.
Place points in 3D coordinates, rotate the view and calculate distances with Pythagoras' theorem.
Drag vector arrows in space, add them and multiply them by numbers. The calculation is shown alongside in column form.
Parametric form and interpreting the parameters in context.
A point travels along a line through space, two vectors span a plane. Parametric, normal and coordinate forms all describe the same thing.
Identical, parallel, skew or intersecting.

Do the lines meet, run parallel or pass each other by? In a 3D space you can turn, intersections, angles and distances become visible.
Intersections of lines using systems of linear equations.
Do the lines meet, run parallel or pass each other by? In a 3D space you can turn, intersections, angles and distances become visible.
The summaries describe the curriculum in our own words. The original text is authoritative. Original text (German): Kernlehrplan, Gymnasium, Mathematics, grade 11