
Direct and inverse proportion
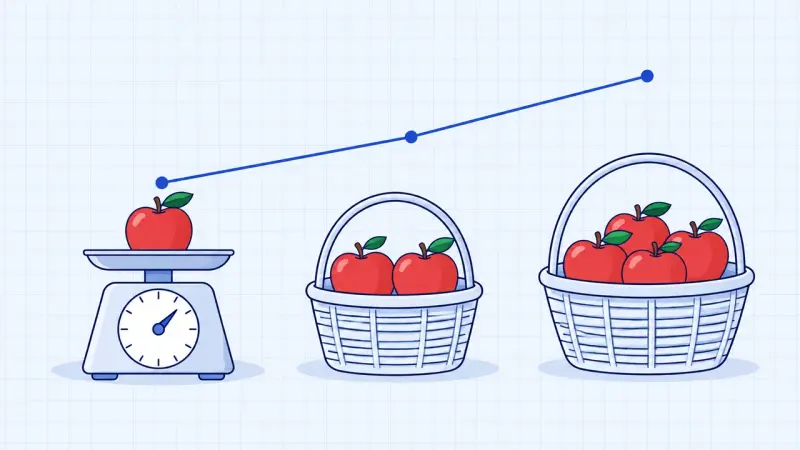
Twice as many apples cost twice as much. Picture, table and graph show together when a relation is proportional, with the rule of three.
MathematicsGrade 6–13 · University
From the concept of a function to linear, quadratic, rational, sine, exponential and polynomial functions – with sliders and draggable points.
Twice as many apples cost twice as much. Picture, table and graph show together when a relation is proportional, with the rule of three.

Exactly one y for every x? The arrow diagram, table and graph tell you straight away whether a relation is a function.
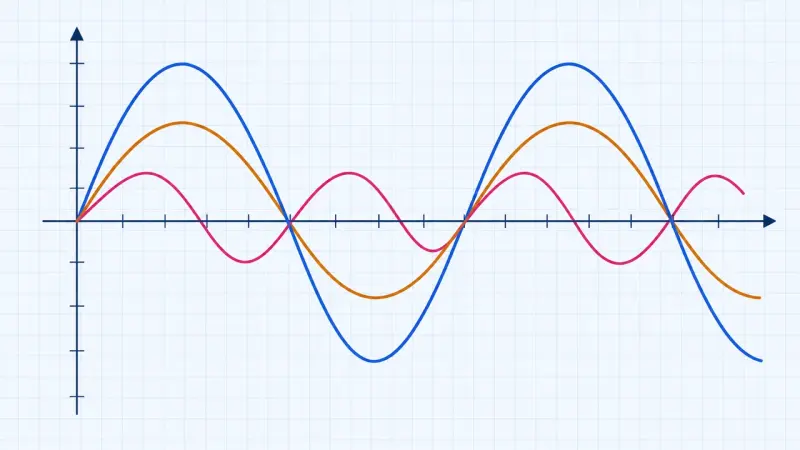
Up to three of your own functions at once, with a table of values, zeros and intersections. The tool for anything that can be a graph.

Change the slope and the y-intercept of a line and read off the slope triangle and the zero.

The hyperbola gets ever closer to its asymptotes and yet never touches them. Shifting and stretching show what the parameters do.

A zero or a pole, a hole or a leap to infinity? Drag the terms of the fraction and the graph shows the difference.

Stretch, reflect and shift parabolas and read off the vertex and the zeros.

Drag three points and the matching parabola always passes through all of them. The equation is worked out step by step.

Which enclosure has the largest area? Picture and graph show the maximum, first by trying, then by exact calculation.
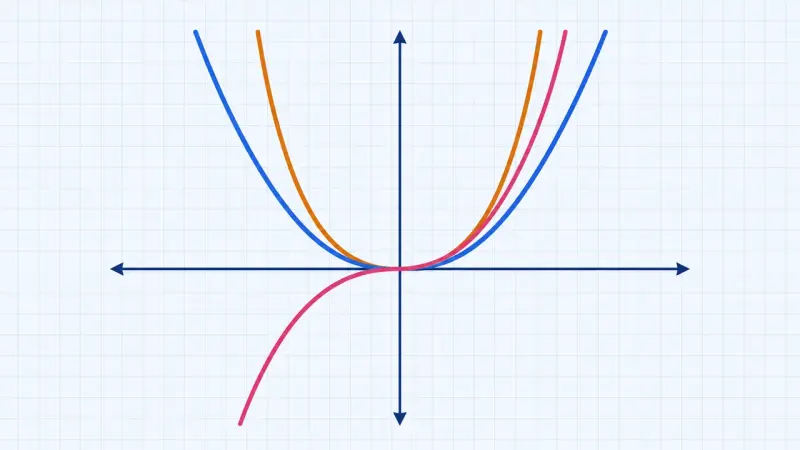
Even or odd, positive or negative: y = a · xⁿ changes with every exponent, and only a few points always stay the same.
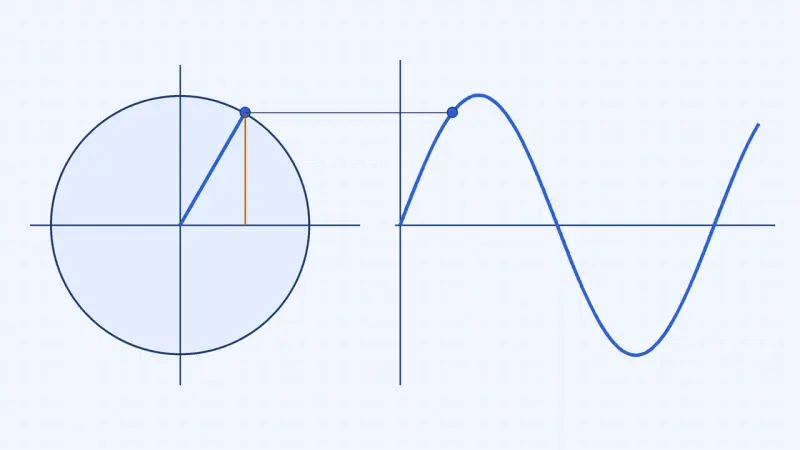
Sine, cosine and tangent on the unit circle, and how the sine curve grows out of it.

Change the amplitude, period and shift of a sine curve with sliders or by dragging.

The logarithm answers the question: to what power do I raise the base to get this number? With graphs, rules and exponential equations.

Water lilies on a pond, compound interest and decay: exponential growth compared with linear growth.
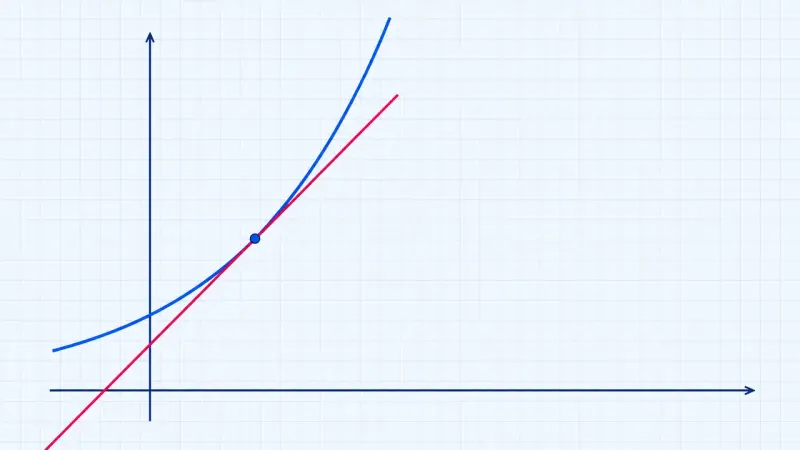
Why is the number e so special? For the exponential function, the graph and its derivative are exactly the same.
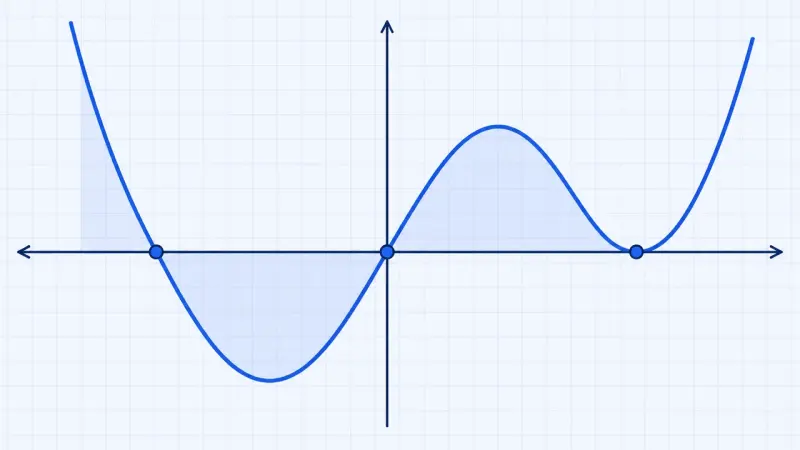
Does the graph cross the x-axis or only touch it? The multiplicity of the zero decides, the highest power decides what happens far out.

Shift, stretch, reflect: every move of the graph leaves its mark in the function's equation.
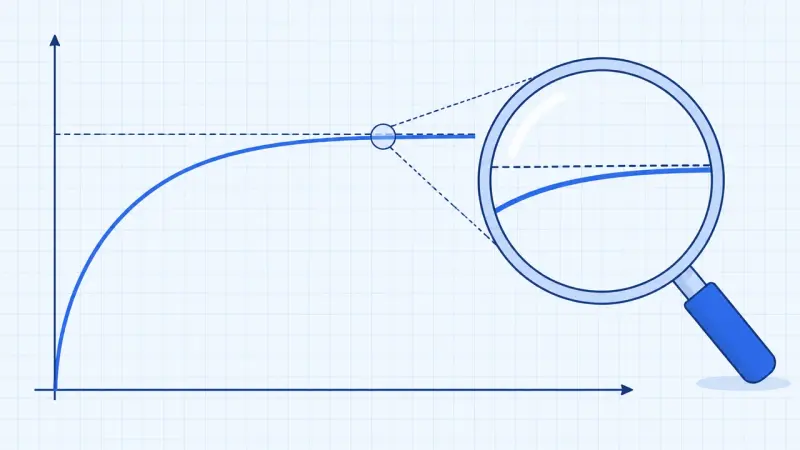
What happens to a graph when x gets very large? A point runs outwards and a magnifier shows how close it gets to the asymptote.
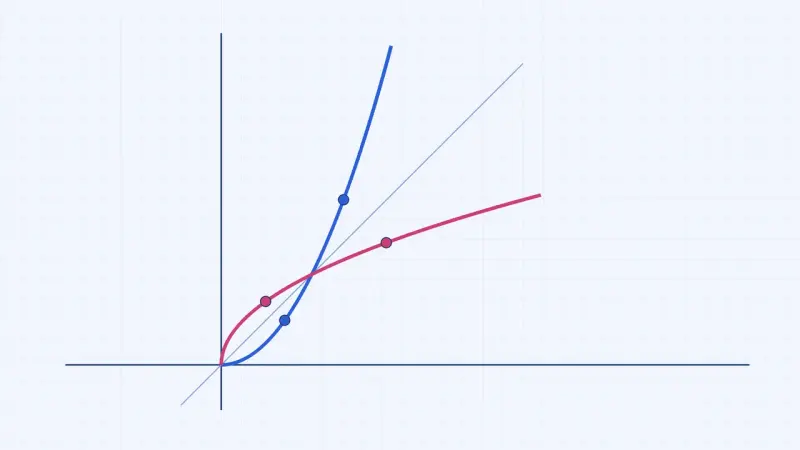
Reflect the graph in y = x and the inverse function appears. It only works if no function value occurs twice.