

Counting principle and tree diagrams
How many outfits or ice cream combinations are there? A tree diagram grows step by step and shows why you multiply the options.
MathematicsGrade 5–13 · University
Display and critically read data, repeat random experiments thousands of times and watch distributions emerge.
How many outfits or ice cream combinations are there? A tree diagram grows step by step and shows why you multiply the options.

Show the same data as bar, line and pie charts and more, and discover how charts can mislead.
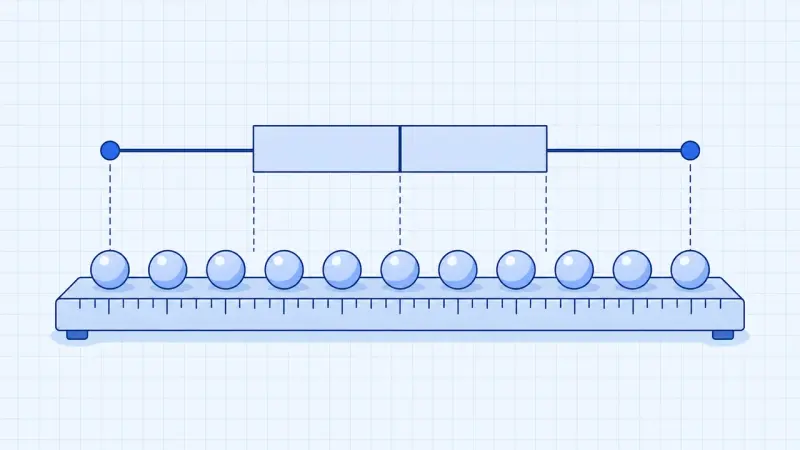
One outlier pulls the mean away while the median barely moves. Dragging single data points shows which value is how robust.

Toss a coin, a die or a drawing pin a thousand times: the more often you throw, the closer the relative frequency gets to the probability.

Draw balls from an urn, with or without replacement. The tree diagram and the path rules show how to calculate probabilities.

How likely is it that two people in a class share a birthday? From just 23 people on, it is more likely than not.

Random points fall on a square with a circle inside. From the share inside the circle you can estimate π.

Play yourself or simulate thousands of games: is it worth switching doors?

A two-way table, a Venn diagram and a tree diagram show the same data and are linked. Change one and the others follow.

A medical test is positive, but how likely is it that you are really ill? 1000 people show why the answer is often surprising.
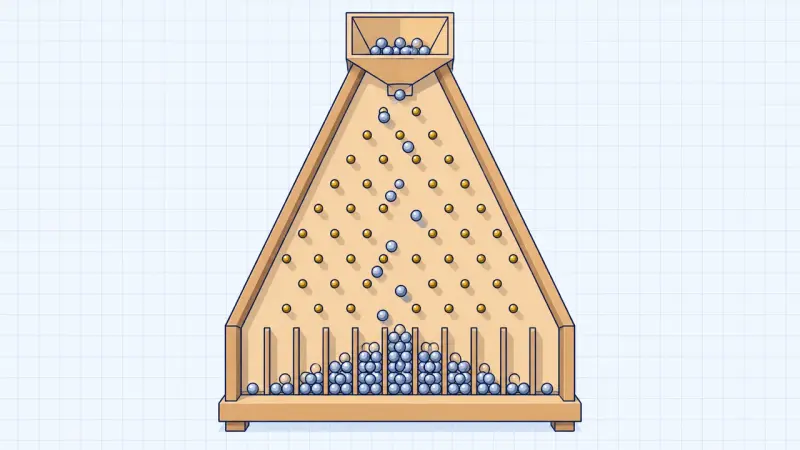
Left or right at every pin, purely by chance. Yet every time the balls pile up into the same bell shape.

The histogram of the binomial distribution: choose a range and read off the probability directly.

A test decides between two hypotheses. Coloured areas show how often it can be wrong.
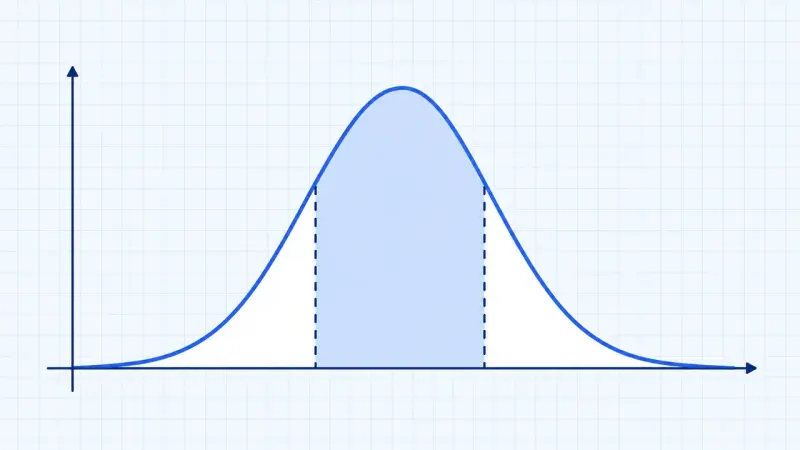
How many bottles are underfilled? Under the bell curve every probability is an area, with the sigma rules as a rule of thumb.