

Place value and rounding
Ten counters make a ten, ten tens make a hundred. Once you have seen the bundling, reading millions and rounding them is no longer a mystery.
Grades 5 and 6: the curriculum describes requirements at the end of grade 6, so the units are the same for grades 5 and 6 and are shown as one stage. The order of the modules is not fixed. The codes are the module numbers of the curriculum (A arithmetic/algebra, G geometry, F functions, S stochastics).
Natural numbers in the place value table and on the number line, the meaning of the four operations, mental and written arithmetic, divisors and prime numbers.
Ten counters make a ten, ten tens make a hundred. Once you have seen the bundling, reading millions and rounding them is no longer a mystery.

A frog hops past zero into the negatives. Thermometers and bank balances show why minus 3 plus 5 makes exactly 2.

An expression drawn as a tree: whatever hangs lowest is calculated first. The order of operations stops being a rule and becomes visible.

Break numbers down into prime factors, check divisibility rules and find primes with a sieve. This also gives you the gcd and the lcm.

From a grain of sand to the Earth in steps of ten. Along the way it becomes clear why 10⁶ is a million and how to write tiny numbers.
Fractions in rectangle and strip diagrams and on the number line, equivalent fractions by simplifying and expanding, ordering and comparing, first calculations with fractions.
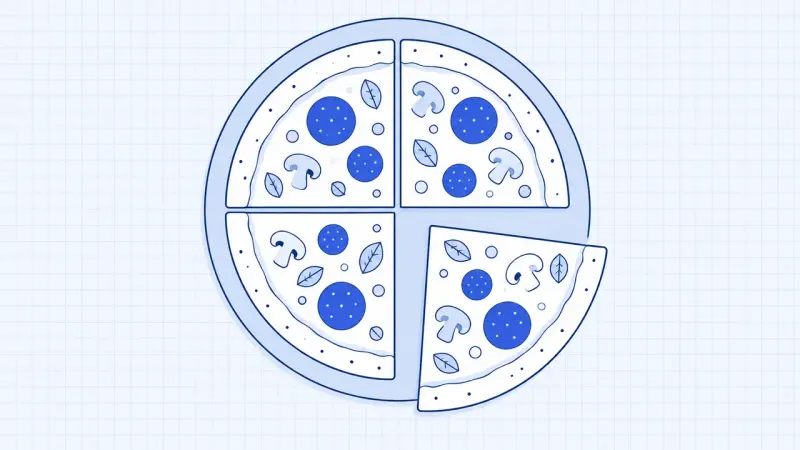
Pizza, cake or a line: share it out fairly first, then colour some pieces. That is exactly what a fraction means.

Compare two fractions as bars or circles. When you expand a fraction, the pieces get smaller but the amount stays the same.

Two strips overlap in a rectangle: the shared area is the product of the fractions. Dividing by a fraction is shown visually as well.
Decimals in the place value table and on the number line, the four operations mentally and in writing, rounding and estimating.
A frog hops past zero into the negatives. Thermometers and bank balances show why minus 3 plus 5 makes exactly 2.

Why does 1/4 end as a decimal but 1/3 never does? Long division gives it away as soon as a remainder repeats.
Estimating and measuring quantities and converting units.

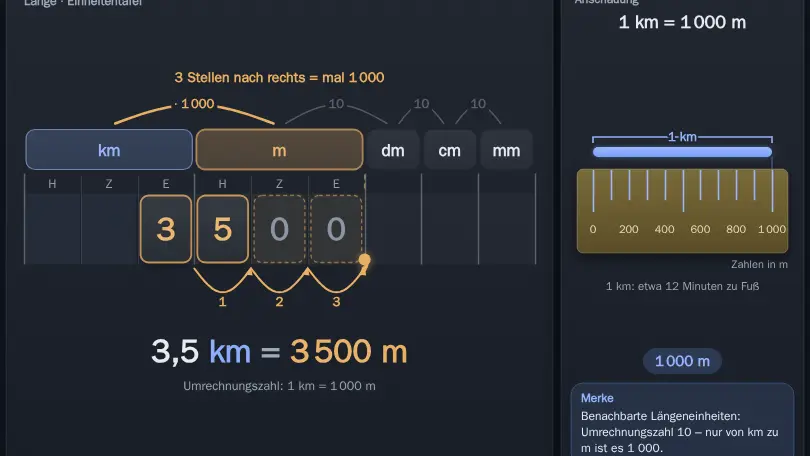
3.5 km is 3500 m, but 3.5 m² is 35,000 cm². The unit table shows why the decimal point jumps twice as far for areas.
Negative numbers in everyday life, extending the number system to ℚ, ordering, sign rules and the four operations.
A frog hops past zero into the negatives. Thermometers and bank balances show why minus 3 plus 5 makes exactly 2.
Ratios as fractions, multiplying and dividing fractions with their meaning.
Two strips overlap in a rectangle: the shared area is the product of the fractions. Dividing by a fraction is shown visually as well.
Naming and classifying quadrilaterals, solids with nets and oblique drawings, models of solids.

Move one corner and the square becomes a kite. When does a quadrilateral get which name?

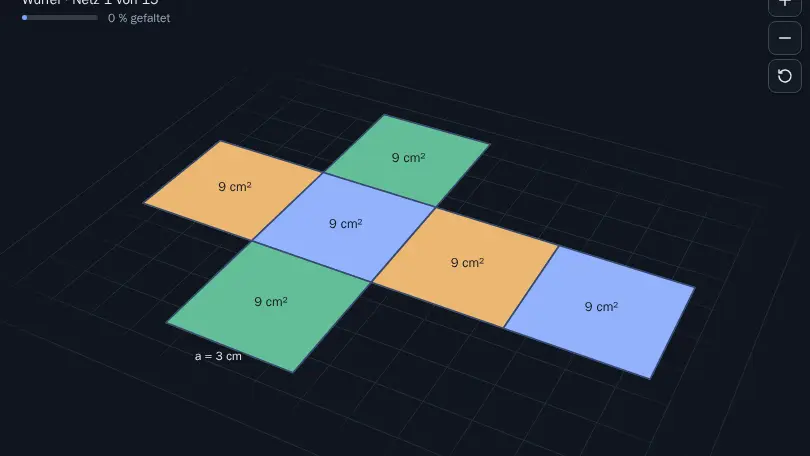
Fold nets of a cube, cuboid, prism, pyramid and cylinder into a solid in 3D and calculate the surface area.
Describing figures and solids with basic terms, perpendicular and parallel lines.
Move one corner and the square becomes a kite. When does a quadrilateral get which name?
Measuring with units, perimeter and area of rectangles, volume and surface area of cuboids.
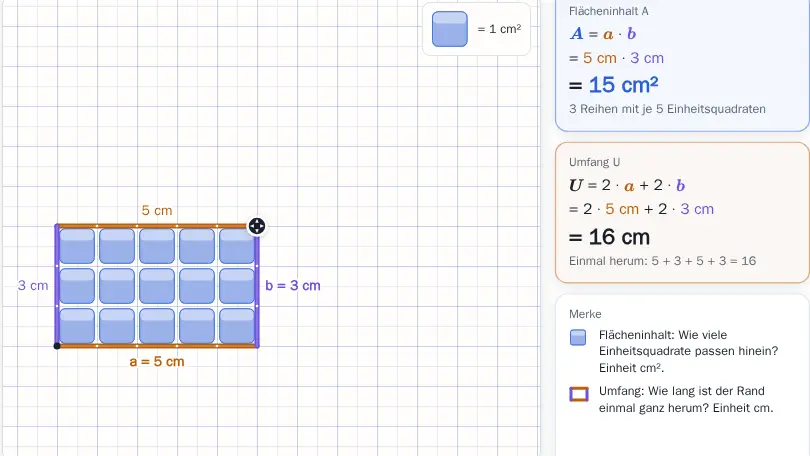

Count the squares or walk once around? An ant makes the difference between area and perimeter tangible.
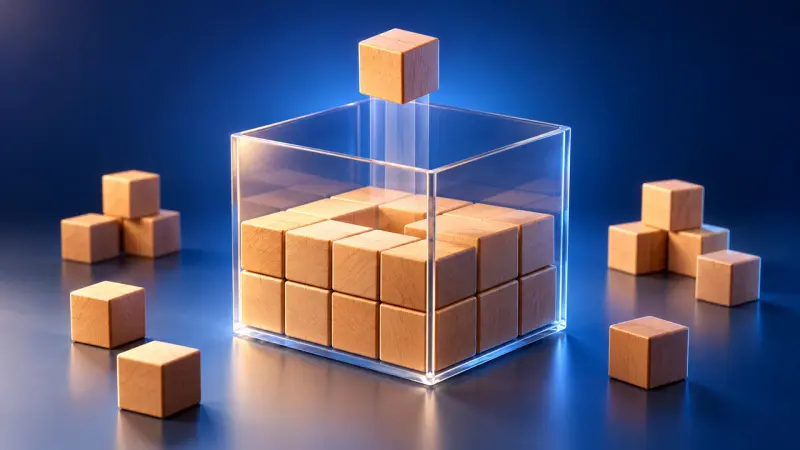
First a row of cubes, then a layer, then the whole cuboid. Length times width times height follows naturally from filling it.
Naming angles, types of angle, estimating, measuring and drawing angles.

Line up the protractor, hit the zero point, read the right scale. The estimation game then shows how well your eye already measures.
The angle sum in triangles, adjacent, vertical and corresponding angles.
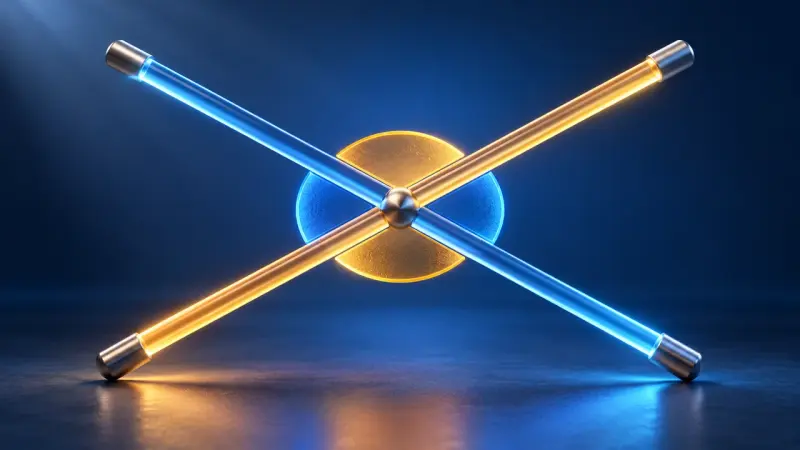
Two lines cross and one of them turns. Which angles stay equal? At parallel lines they are called corresponding and alternate angles.
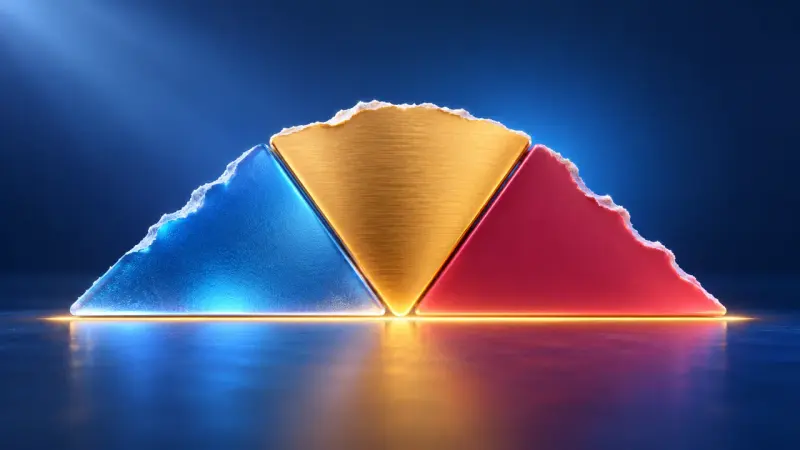
Tear off three corners, put them side by side, and you get a straight line: 180°, for every triangle. A quadrilateral gives 360°.
Translating figures in the coordinate system and reflecting them in lines parallel to the axes.
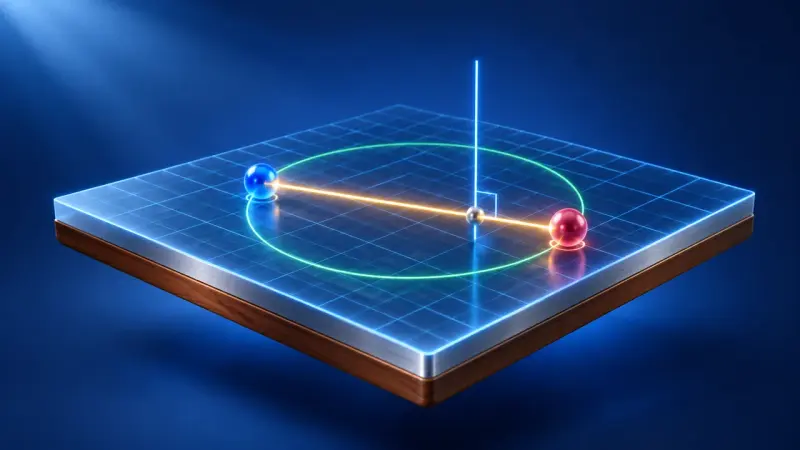
Place and read points in a coordinate system, draw segments and lines and check whether they are parallel or perpendicular.

In a line or in a point: the shape flips over, and every construction step with the set square stays visible.
Estimating quantities with reference objects, reading quantities from scale drawings, drawing to scale.
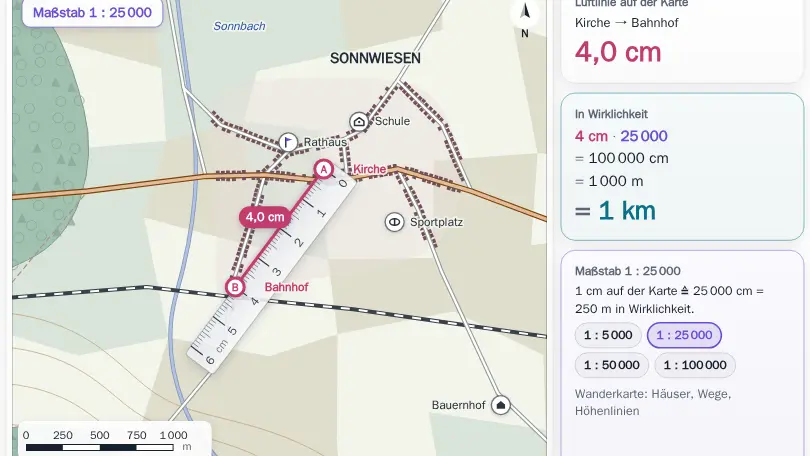

Measure on a map with a ruler and use the scale to work out the real distance.
Coordinate systems with suitable scales, plotting and reading pairs of values, drawing and interpreting distance–time graphs.
Place and read points in a coordinate system, draw segments and lines and check whether they are parallel or perpendicular.

Exactly one y for every x? The arrow diagram, table and graph tell you straight away whether a relation is a function.
Planning surveys, data in lists and tables, bar charts, median and range.
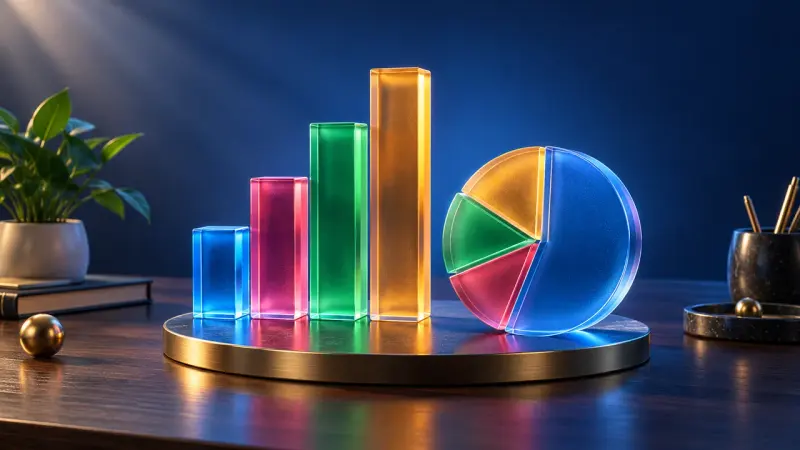
Show the same data as bar, line and pie charts and more, and discover how charts can mislead.
Random experiments and first probabilities.

Toss a coin, a die or a drawing pin a thousand times: the more often you throw, the closer the relative frequency gets to the probability.
The summaries describe the curriculum in our own words. The original text is authoritative. Original text (German): Bildungsplan, Gymnasium, Mathematics, grade 5/6